The usual web performance metrics (First Byte, Speed Index…) are very interesting but I often need to add custom temporal markers, based on events that make sense from a business point of view, like:
- the moment a specific content or feature is available to users
- the beginning and end of the display of a loading animation (useful in complex funnels!)
- in a page broken down into components retrieving their content from an API, the specific display times of each component
- etc.
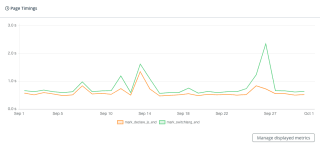
I use the User Timing API (see on MDN) to create named timestamps that belong to the browser’s performance timeline. As I can retrieve this timeline in Dareboost or Contentsquare Speed Analysis, I can track their evolution over time.

Some Custom Timings of this site
Using the API in JavaScript is quite simple (and broadly supported), for example:
// The thing you want to monitor the occurrence of
document.getElementById('content').classList.add('blue');
// The timestamp
performance.mark('mark-blue');
You can then retrieve the value in your browser developers tools, using:
performance.getEntriesByType('mark');
However, I recently1 realized that I often forgot something important: just because the browser execute some JavaScript code does not mean that the user can see the results of this execution. The browser must update the display, and its ability to do so depends on the JavaScript code that follows the piece of code we’re interested in.
In the following example, I inject a 1-second blocking loop after my performance mark, preventing the browser to update of the display.
// The thing you want to monitor the occurrence of
document.getElementById('content').classList.add('blue');
// The timestamp
performance.mark('mark-blue-sync');

// A snippet of code that consumes resources during 1 second
let n = performance.now();
while (performance.now() - n < 1000) {}
Of course, in real life, you won’t have a simple loop. You will have other tasks that may or may not take a long time. You can’t know it and, in fact, you can’t even test it, because it all depends on the customer context that you don’t control.
To get around this problem, we can use requestAnimationFrame() to ask for our mark to be put set before the browser performs the next repaint:
// The thing you want to monitor the occurrence of
document.getElementById('content').classList.add('blue');
performance.mark('mark-blue-sync');
// The timestamp, before the next repaint
window.requestAnimationFrame(() => {
    performance.mark('mark-blue-frame');
});

// A snippet of code that consumes resources during 1 second
// but we don't care anymore
let n = performance.now();
while (performance.now() - n < 1000) {}
If you want to see this for yourself, here’s a test page.
IN A NUTSHELL
Call the User Timings API to create custom business-related timestamps.
Encapsulate them inside requestAnimationFrame() callbacks to get to understand how the UI behaves, rather than the code execution.
If you want to have an idea of the display latency, attach two marks: one after the event to be followed, the other in a requestAnimationFrame() callback.
-
Reading “Performance metrics for blazingly fast web apps”, by Conrad Irwin ↩