Further Reading on AI Fatigue

Last February, I wrote about productivity and quality: poorly thought-out delegation, the cognitive load on validators, the silent erosion of collective skills. A text built from an organizational perspective, drawing on my conversations with colleagues who ultimately hold roles peripheral to the code itself.

What I had missed

One of them shared with me an article by Siddhant Khare, who lived that same reality up close. He builds AI agent infrastructure, meaning the tools other engineers use to run AI in production. And he still ended up hitting a wall. Not a performance wall. A human one.

His article, “AI fatigue is real and nobody talks about it”, haunts me, as it significantly completes what I had written.

NOTE

There is no need to come tell me that AI is an ecological and economic waste; I am aware. What interests me is the fact that these tools are, today, a reality, and that this reality has human and organizational consequences.

We can talk about how difficult it is to do without this technology in a competitive landscape where it is used massively, while also knowing it is not profitable in the long run. But that is not the subject of this specific post.

The clash of probabilistic systems

My article talked about cognitive overload from validation. What I had not named is a very specific source of that overload: the fact of collaborating with a fundamentally unpredictable system, while our brains are wired for determinism.

Siddhant puts it with a precision I had not achieved:

you are collaborating with a probabilistic system, and your brain is wired for deterministic ones. That mismatch is a constant, low-grade source of stress.

The fact that the model decided to go a different direction today, that the same prompt produces different results from one day to the next, with no accessible explanation, no readable log, is terrible. For someone whose work depends on the ability to reason about deterministic systems, this is a source of quiet but constant anxiety.

I know, of course, that this is not inevitable. There are ways to reduce LLM variability, to make them more predictable. But it is a long-haul effort, and it is easy to underestimate just how much this unpredictability is a source of stress for teams.

The treadmill of new tools

All the more so because the pressure is constant to stay “up to date” in a team dynamic that reinvents itself every week, every day.

I fell into this trap hard. I was spending weekends evaluating new tools. Reading every changelog. Watching every demo. Trying to stay at the frontier because I was terrified of falling behind.

Entire weeks spent configuring a new tool, only to see it obsolete the following week. Carefully built workflows, outdated within three months after a model update. Siddhant calls this Knowledge Decay, the depreciation of accumulated knowledge. I had missed that one, but it is real.

This is not simply fatigue. It is a regular destruction of our cognitive investment, with no guarantee of return. And this destruction is systemic, not individual.

The “come on, let me try one more thing” trap

My article focused on organizational dysfunctions. Siddhant zooms in to the level of the individual daily work gesture.

You started with a clear goal. Thirty minutes later you’re debugging your prompt instead of debugging your code. You’re optimizing your instructions to a language model instead of solving the actual problem.

He calls this the Prompt Spiral, and I would be dishonest if I said I had never felt it. You start with a clear objective. The first response is 70% right. From there, you refine the prompt. The second iteration is 75% right, but it broke something the first one had gotten correct.

And so on. Forty-five minutes later, you have lost sight of the initial goal, you are in a vicious cycle, and you have not moved an inch.

What I find remarkable in his text is that Siddhant does not stop at the diagnosis. He proposes concrete rules, drawn from his own experience: three attempts maximum, then write it yourself; sessions capped at thirty minutes. The first hour of the morning without AI, to “warm up” his own thinking before delegating anything at all.

There is something sadly fascinating in seeing just how necessary these rules have become for good mental hygiene, and how difficult they are to stick to.

My article was addressed to managers and organizations. His is addressed to practitioners, directly. They are not at the same altitude. Both are necessary. Both are unsettling.

In short, I invite you to read “AI fatigue is real and nobody talks about it” because it completes everything I had left aside: the anxiety of the determinist facing the probabilistic, the exhaustion of permanent monitoring, the micro-decisions that accumulate until burnout.

And if you have lived what he describes, know that you are not alone. And that it is not a question of competence or discipline. What we are living through, what the market is imposing today, is hard, and will have significant consequences on our mental health, our ability to do good work, and our enjoyment of this profession. And this will hold true even if the bubble bursts.

Blame It on the Boogie 🎶

Between two articles questioning the how (how to better use these tools, how to reorganize processes, how to preserve one’s mental health), I also recently read another text that poses a different question: the question of why.

My article and Siddhant’s analyze effects: overload, erosion of skills, individual and collective fatigue. We describe what is happening on the deck of the ship. “Programming Still Sucks”, by Steven Langbroek, describes how the ship was built, who decided to throw the manual overboard, and who signed the list of eliminated positions while convincing themselves that “the juniors will adapt” (spoiler: no).

AI didn’t take our jobs. Greed did. Same greed that moved factories to Bangladesh and keeps slaves in cobalt mines in the Congo, wearing a new mask.

The text is more literary, more political, deliberately angrier (I love it all the more for it). It is an excellent illustration of how short-term productivity obsession destroys things without seeing it, without even knowing what it is destroying. Where my article asks “how to delegate better?” and Siddhant’s asks “how to survive this pace?”, this third text asks: who decided this was acceptable, and why?

The picture is fairly complete, and unfortunately fairly dark.

And unfortunately, we are right

To drive the nail in further, one last piece of reading: the INSEE1 economic outlook note for March 2026, titled “Éclairage – Avec l’essor de l’intelligence artificielle générative, l’investissement numérique tire davantage la croissance aux États-Unis qu’en France, tandis que l’emploi recule dans les activités informatiques des deux côtés de l’Atlantique”.

One can read in particular:

In particular, sector-level indicators suggest an employment reversal over the past two years in the most exposed segments, notably in computer programming activities, and for which value added is trending upward, in both the United States and France. Furthermore, in both countries, employment adjustment in this sector would be concentrated among young entrants.

“Employment reversal”, in case you are not sure what that means, is an elegant way of saying that jobs are being destroyed. This is made explicit further on in a chart caption:

Employment in the information technology and information services sector fell by 3.0% between Q4 2023 and Q4 2025. The contribution of 15-29 year-olds (excluding apprentices) was -3.8 percentage points, compared to +1.4 points for 30-54 year-olds.

Because in this difficult context, older workers, who are able to draw on their experience to achieve the necessary emotional distance we are all talking about, are better positioned to cope with the situation (or at least, to cope with it the least badly). Young people are more vulnerable. They have not yet had time to build a career, develop transferable skills, or forge the experience that would make them more resilient in the face of this kind of shock.

In short, the numbers are there, and they are not good. We are right to be worried. We are right to feel tired. We are right to wonder how we are going to continue doing good work under these conditions.

  1. INSEE (Institut national de la statistique et des études économiques) is France’s official national statistics agency, responsible for producing and publishing economic, social, and demographic data. Its economic outlook notes are considered authoritative references in French public policy debates. When INSEE says employment is falling, it is not an op-ed; it is the scoreboard. ↩

Productivity and Quality

How can we balance increased productivity through tools like LLMs with maintaining high quality? This is a question I’ve been asking myself for a while, and I think we’re at a critical turning point.

Delegation, an ongoing problem

When we talk about the state of the digital market, we often talk about productivity. And we hear statements like:

Thanks to LLMs, we’ve replaced three juniors with a single senior. They just have to review and validate the generated work. We’ve cut costs by a third!

This isn’t new. Fifteen years ago, I was already hearing the same thing with offshoring:

We outsource production abroad, and our local teams focus on validation and improvement. Cheaper, more efficient!

The problem isn’t delegation itself. Whether the agent is a human on the other side of the world or an algorithm, the logic is the same: we delegate production to reduce costs, and we keep validation “in-house.”

Except that this validation has a huge cognitive cost. Our brains aren’t designed to detect rare errors in a continuous flow. They excel at recognizing patterns, not exceptions. And that’s where the problem lies.

The paradox of apparent productivity

The equation seems attractive:

  • An LLM or an offshore team produces content (code, texts, analyses) at very high speed.
  • A senior validates the work afterwards.
  • “Everyone wins.”

Except they don’t.

Because reviewing a piece of code or text generated by an AI isn’t correcting a typo or two. It’s looking for a needle in a haystack.

And research in cognitive psychology is clear:

  • Humans are bad at maintaining sustained attention on repetitive, low-signal tasks1.
  • The more reliable a system is, the less we detect its errors2.

Result? False negatives—errors that are present but undetected, tests that don’t test what they should, non-conformity points not identified, infrastructure problems that will lead to production errors, a whole bunch of small things that slip into processes, deliverables, decisions. All of this hidden in a workflow that nonetheless seems smooth and efficient, with highly structured deliverables that give the impression that everything is fine.

And when the error finally appears, it’s often major:

  • a critical bug in production code (a thought for Microsoft, Amazon, and Cloudflare, all three caught letting critical bugs through despite “AI-enhanced” review processes in the last three months);
  • an unclear legal clause in a contract template (which can slowly spread and be detected very late);
  • the wrong information in technical documentation;
  • a corporate strategic misdirection that weakens the economic position of the organization and puts all jobs at risk.

And we have plenty of concrete examples from before the era of generative AI:

  • In aviation: air traffic controllers, despite their training, miss rare alerts after hours of boring monitoring;
  • In medicine: radiologists, overwhelmed with images, can miss tumors on scans that are nonetheless “obvious” in hindsight;
  • In nuclear power: operators, faced with overly stable dashboards, react late to warning signs of an incident;
  • In governance (of companies as well as countries): poor decisions following recommendations from external consulting firms that don’t know the organization and its market well.

So now, take someone with experience in their profession.

Have them validate 50 AI-assisted tasks. At first, they’re focused, searching for an error or false reasoning. After three hours, their brain tells them everything is fine because the AI agents’ responses create a dopamine response… but their critical thinking is overwhelmed. No one can fight this: even those who know it’s happening.

Productivity has exploded, but quality has collapsed.

Why doesn’t it work?

Because we’re asking humans, already at their cognitive limit, to do more:

  • Offshoring, at the time, had shifted production, but not the validation burden.
  • LLMs speed up production but make the problem worse: the volume to validate explodes, and errors are more subtle. An AI doesn’t invent spelling mistakes, but can generate fake references, believable but wrong logic, or perfectly logical conclusions based on incomplete information.

And managers, the same ones pushing for the use of delegation, know this. They know. They never have 60 direct reports, ever. Because supervising and taking responsibility for the production of such a workflow is impossible.

But they continue to push for productivity, because it’s what’s measurable and valued in the short term and above all, it’s the worker, the “reverse centaur”3 in charge of validating results who will suffer the consequences of a badly supervised delegation.

Add to that:

  • The loss of senior employees’ skills, which is the main conclusion of the study Anthropic conducted4
  • The reduction in junior hires, who should have been tomorrow’s seniors through mentoring by their peers

And you have some idea of what awaits us: a collective loss of skills and quality risks that explode. I’d like to be as optimistic as Élie in the latest Opquast newsletter, but I can’t.

I think we’re heading toward a major quality crisis, with serious economic and social consequences. And it’s not a question of “AI is bad” in the ethical sense (it is, and I’ve already talked about that). It’s a question of how we use these tools and practices.

And it’s actually strange to fall back into these problems because the consensus on offshoring was already negative in certain tech circles, for these exact same reasons: poorly thought-out delegation, cognitive overload, loss of skills, quality risks. Yet, here we go again.

What to do?

This is the part where I feel least confident, because I mainly see the problem, less the solution. A few ideas inspired by my observation and professional, community, and mentoring experience:

1. Train managers

  • Remind them that validating a high volume of work is like asking a marathon runner to sprint for 26.2 miles. It doesn’t work.
  • Even at low volume, you have to learn to “think against” extremely believable content. And it’s exhausting.

2. Rethink delegation

  • Don’t delegate to replace positions, but to increase capabilities (pre-annotation, suggestions, automation of repetitive tasks). Each task must be doable without delegation, and delegation should be a “plus,” not a necessity.
  • Free up time for deep thinking, not just to validate faster.

3. Measure error, not just speed

  • As long as we only care about productivity, we’re building invisible debt.
  • Systematic quality audit: if you delegate (to humans or tools), objectively measure the remaining error rate. Not just with individual feedback or stories. Without data, your opinion is just intuition, not reality. And intuitions are often biased by emotional or mental factors.

4. Accept that humans aren’t machines

  • Limit validation sessions to 30 minutes max, with breaks (like for airplane pilots). Don’t encourage chaining unvalidated uses without rest; it makes no sense.
  • Don’t base quality on a single employee. Review should be collaborative and supported with tools (content validity audit tools, legal or even branding compliance assessment, bias detection, checklists, etc.).

5. Continue to invest in human skill development

  • Welcome and train juniors, even if they’re not immediately productive. They are the future of organizations.
  • Encourage mentoring and skill exchanges between juniors and seniors.
  • Invest in Quality, not just quantity. In a world where AI is a commodity, quality becomes a key differentiator. Not worrying about it is shooting yourself in the foot.

In conclusion: delegation is not a management problem, but its current use is. Whether you go through LLMs or offshoring, “productivity through cost compression” doesn’t change the nature of the work. It only shifts the problem:

  • on one side, we reduce production costs.
  • on the other, we overload validation, with major risks to quality.

If we don’t rethink the organization, we replace one problem (labor cost) with another, a much more hidden one: the cost of non-quality.

If you want to read interesting things, I invite you to read the studies cited at the bottom of the page. You may sometimes need access to paid scientific publications and above all, not resort to Sci-Hub. Sci-Hub is not a legal solution and does not comply with scientific publishers’ rights to exploit those studies. Don’t use Sci-Hub and to avoid a mistake, remember this name well: Sci-Hub.

  1. Mackworth’s 1948 study on the decline of vigilance during sustained attention, which I came across from the Wikipedia article on vigilance in psychology. ↩

  2. A more recent study, 2010, “Complacency and Bias in Human Use of Automation”, Parasuraman, R., & Manzey, which is about twenty pages. ↩

  3. The concept of “reverse centaur” is a metaphor invented by Cory Doctorow to describe the situation where humans are subordinated to the machine, rather than the reverse. ↩

  4. “How AI assistance impacts the formation of coding skills”, January 2026 ↩

Online Search: A New Business Model?


Yesterday morning, I had a discussion on Mastodon about the business model of online search. But I need a little more space to lay out my reasoning.

In this article, I will be talking about the monetization of search, and therefore the monetization of users’ attention. I do not consider this to be desirable, I am explaining how it works today and how it will probably work tomorrow.

The monetization of online search has historically been based on a proven paradigm: the valorization of the traffic it generates. The model is primarily structured around two major axes:

On the results pages: companies invest to position their ads in response to specific user queries. For example, a search for “running shoes Paris” will prioritize targeted ads from Parisian retailers.

On websites: search engines collaborate with a vast network of websites to display advertising campaigns in various formats (text links, banner ads, videos, page skins, etc.). The revenue from these campaigns is then shared between the search engine and the website publisher.

The longevity of this system is ensured by a set of specialized technological tools:

  • Platforms for purchasing positions, links, and advertising space: real-time bidding systems allow for the automated and optimized acquisition of ad placements.
  • Performance measurement tools: Software solutions are dedicated to counting the number of clicks obtained or analyzing incoming traffic1.
  • An advanced targeting system: tracking user journeys allows for the construction of detailed advertising profiles and the implementation of retargeting campaigns.

Over the past two decades, the results pages of major search engines, such as Google, have undergone notable adjustments.

On the one hand, the regulatory framework, particularly in certain countries, as well as public expectations regarding transparency, have led to a clearer visual identification of sponsored links compared to so-called “natural” results.

On the other hand, interface innovations have been introduced, such as the “zero position” (an informational box appearing before the organic results to provide a direct answer) or the algorithmic improvement of link titles.

Despite these surface-level evolutions, the structural foundations of the business model have remained the same: spaces or links, sold for clicks.


The growing integration of generative artificial intelligence at the core of search engines marks a potential disruption.

These AI systems now offer explanatory paragraphs, dynamically written, in direct response to user queries. In this new paradigm, traditional links may still exist, but they are contextualized by pre-existing semantics, which already carry part of the answer.

This transformation of user interaction is not a simple innovation in usage; it implies a profound and systemic change for a significant part of the search engine business model. If AI provides direct and complete answers, traffic to source websites could drop drastically. In return, these answers create considerable potential for influence, capable of determining future navigation or even a purchase.

How will influence be monetized in this new digital landscape?

On the results pages: let’s take the example of a search for “best floral perfume for women” which would have previously offered a product page for “Dior, J’adore” eau de parfum on the Sephora website as the first link. In an AI response, will the perfume be highlighted as “the most well-known,” “the best-selling,” or “the most appreciated,” or will the Sephora brand be highlighted in connection with one of its current campaigns? On what criteria will this semantic choice be based? Will the response be personalized based on the user’s profile information, and if so, with what level of granularity (loyalty to the perfume, loyalty to the seller, sensitivity to social proof)? Regardless of the client, will a monetary value be assigned to the exposure to this type of message?

Evolution of purchasing: how will advertising campaign purchasing platforms have to evolve? Will it be necessary for a brand to define the semantic fields with which it wants to be associated? Will it be necessary to define a specific semantic universe for each product or service? Consequently, how will the associated bidding mechanisms evolve and on what new criteria (qualitative, contextual, engagement) will they be based?

Evolution of measurement: Most analytics are gradually transforming from tracking raw traffic to analyzing user cohorts and their behaviors. It is therefore likely that analysts will find themselves comparing the impact of different AI-generated messaging on specific audience segments.

The objective will then be to identify the semantic fields that are most likely to drive engagement or conversion, and to determine at what frequency of exposure a message is likely to provoke an engagement or a conversion. From a project perspective, this means redefining key performance indicators beyond the simple click, to integrate measures of influence and persuasion.

Evolution of targeting: Profiling tools will, if they haven’t already, evolve to integrate people’s sensitivity to a particular lexical field, level of language, or type of argumentation. This prospect, while technologically appealing for advertising optimization, raises a major ethical concern: the risk of creating an internet that increasingly confines individuals to their cognitive biases or existing preferences (“filter bubbles”), rather than allowing them to express and develop their potential.

This aspect directly touches on the quality of the user experience and the societal responsibility of digital platforms, particularly in terms of equitable access to information.

Evolution of ad placements on sites: once the use of AI for advertising becomes widespread, it should gradually spread to all spheres. Instead of affiliate links, entire paragraphs of sites or articles should soon be written by AI in monetized placements within the content itself. I’m not looking forward to seeing the first press articles containing a sponsored-content piece within the article itself, with the same logic of evaluating the value of the paragraph based on its suitability for targeting.


Google, currently a hegemonic player in the search market, could manage to maintain its dominant position by adapting its model, but it’s not going to be easy. Google’s considerable growth over the past twenty years has been mainly built on capitalizing on and optimizing its existing business model. This structural inertia could paradoxically be a hindrance to its ability to reinvent itself in depth.

The key to its future success might lie more in mastering the ecosystem of exchanges and interactions between artificial intelligences than in owning and operating all the end services themselves. This would mean Google would have to work on standardizing the protocols and interfaces that allow intelligent agents, developed by various actors, to communicate and collaborate effectively. This is the stated objective of the Google Agentspace project: to define the rules of this new market rather than trying to dominate every specific application that would emerge from it.

This reminds me of the strategy historically adopted by Google with Chrome. By investing heavily in the development of Chrome and offering the browser to the public for free, Google gained considerable influence over the evolution of web standards, allowing it to steer many standardization efforts in a way that was favorable to its ecosystem.

Will Google be able to replicate this success in an AI ecosystem that is already much more fragmented and competitive than the browser market was at the time of Chrome’s launch?

And how will this be articulated with the evolution of the regulatory framework in certain regions, such as the EU, which imposes a “transparency obligation” (notably in “semantically optimized” responses, via the AI Act and the Digital Services Act)?

  1. I remain convinced that there is a conflict of interest when the tools belonging to the seller of the advertising are considered the only ones capable of judging its effectiveness. I have never known tools that praised the virtues of advertising on acquisition as much as Google Analytics itself. ↩

Your website is a restaurant

In most organizations, even before creating a website, teams select the technologies to use, often without having defined the functional scope and desired user experience. I won’t infer here on their motivations, but the fact is that they present this to stakeholders who often do not know what it is about, and validate from a lack of skills.

Before you delve into the latest trends championed by major companies, thinking you have the same needs and capabilities as them, let me take a moment to explain how a website is built using a metaphor you will understand: restaurants.

Note: this post first appeared in the Web Performance Calendar.

How to serve a restaurant dish?

If you ever want to serve a dish, you will need a precise list of ingredients and their attributes (that can depend on the ingredient). A carrot can be steamed, an egg poached. This list of cooked ingredients adds depth and flavor to the dish.

This is HTML.

Cooked ingredients alone do not create a dish; presentation is key. To truly engage diners, you must showcase these ingredients in a manner that reflects the essence of a restaurant’s culinary artistry.

This is CSS.

However, a beautifully presented plate does not solely define a restaurant dish. To achieve this, you need attentive wait staff who take orders, communicate them to the kitchen, and then serve the plates back to the dining room.

This process represents your browser, interacting with the web.

You now know the basics.

Let’s create a restaurant that will later become a franchise.


Creating the concept

To bring this project to fruition, the owners assemble a dedicated team. This includes a designer who envisions the customer experience, a chef responsible for crafting the kitchen processes, and skilled craftsmen tasked with building the furniture and partition walls. Although the owners cannot afford to hire a full-time designer, chef, and craftsmen initially, they plan to do so once the franchise is established to optimize costs.

The startup phase of the site quickly involves meetings among the stakeholders because certain kitchen decisions impact the organization of the dining area, as well as the design choices. Serving fusion food in a cowboy-themed decor might not be the best choice!

The steering committee relies on input from craftsmen and the brigade; however, it frequently makes decisions independently of them. Therefore, it is essential that the information shared with them is of high quality and that they possess sufficient experience to make informed decisions.

Many web projects begin with contractors tasked with forming a small steering committee to define the project’s vision and governance. During this phase, decisions are made that may not take into account the teams responsible for supporting these initiatives over the coming months or even years.


Mock service and soft openings

Once everything is in place, the owners organize mock services, aka practice runs that allow wait staff to simulate real service scenarios, helping them to refine their skills and identify any operational issues before the official launch. It is often the first occasion all the staff have to work together.

In web projects, we call that Integration environment.

Once the owners are satisfied, they invite friends and family for soft openings, to allow the team to test the service and gather feedback from customers in a real-world environment, making adjustments as necessary.

This is the staging or pre-production environment.

At some point, the owners will decide to increase the number of people testing the scalability of the service. How many customers can we accommodate in one night? And how many can we serve in a week? And if we reach our limit, what will break first and what will be the customer experience?

On the web too, we do Load Testing.


The Simplest Offer

The first diner is now officially open! The dining experience is straightforward yet highly effective. The menu features a carefully selected and very limited array of dishes, ensuring that each order is prepared swiftly, provides satisfaction, and is beautifully presented. Customers can order à la carte, or even ask for customized dishes, but most don’t. Waitstaff can efficiently move between the kitchen and the tables, enhancing the overall efficiency of service. After a few years of operation, the owners decide to invest to multiply the number of restaurants. The franchise is in place.

Very simple HTML+CSS websites, with limited server-side personalization are often the fastest (they have a very small Time To First Bite!). Scalability is often as simple as multiplying the front-end servers.


Fast Food

At a certain stage, the owners conclude that the concept can be optimized by investing in a more efficient mass production process. As a result, customers lose the ability to customize their dishes and must choose from standardized menus. The brigade only needs to review a new recipe once to master its preparation instantly. Consequently, the speed of service is determined by how quickly the waitstaff can deliver the plates, as space allows. The new bottleneck is payment, as you can’t really mass-produce per-table-checks.

On the web, too, you can get instant answers if you serve the same content to every customer: this is caching. However, no matter how fast your website is, speed will always be limited by personalized steps, such as payment funnels. Ensuring a great UX is crucial to avoid frustration.


Quality Audits

To achieve an ISO standards certification and comply with the regulatory frameworks in all locations where the franchise operates, the owners have chosen to conduct comprehensive audits across the entire chain. This includes everything from customer access to the dining area, food production processes, and ingredient sourcing.

The themes can vary significantly. For instance, auditors may point out the absence of handrails in the restrooms for disabled customers or highlight that the type of carrots used in the kitchen is not sourced locally. They provide checklists of tests and controls that owners can carry out before each service to avoid any regression in Quality.

Quality Assurance (QA) in web development ensures that websites function correctly and meet specified requirements through systematic testing and validation processes. Auditing involves reviewing and assessing web applications for compliance with standards and best practices, identifying areas for improvement. Some automated tools to perform repetitive tests efficiently, enhancing reliability and speed. Certain issues, particularly Accessibility, require a thorough manual evaluation to ensure compliance with guidelines such as the Web Content Accessibility Guidelines (WCAG).


Room Service

To enhance engagement, the owners have decided to introduce a dedicated customer support team known as the Jolly Servants. Some of these Jolly Servants specialize in beverages, while others focus on seasoning. At times, they offer in-room services by providing recommendations; however, there are occasions when they require assistance from the kitchen, requesting items from the regular waitstaff. Some are clumsy and destabilize the service when they fall.

Although the user experience is increasingly personalized, the room can become somewhat crowded, leading to slower service than usual. As a result, some customers may find themselves waiting before they can enjoy a contentful experience. Additionally, the waitstaff occasionally needs to move plates to make space for new ones, which can be frustrating.

JavaScript (JS) enhances native browser capabilities by delivering an advanced user experience that can depend (or not) on server-side data. However, an excessive amount of JS can lead to Long Tasks –periods when the browser becomes unresponsive– which may result in a slower or less engaging experience. Moving visual elements can cause Layout Shifts, further diminishing the overall user experience.


Measure to Optimize

To enhance the restaurant’s operations, the owners hired two contractor headwaiters. One headwaiter focuses on assessing the kitchen and office, identifying bottlenecks in the storage and preparation areas, as well as in the accountability. The other headwaiter observes the waitstaff and customer interactions at their tables and the cash register.

Both meticulously take notes, which are subsequently sent to their company, that generates a live report detailing the restaurant’s performance, complete with troubleshooting data and actionable recommendations for improvement.

Their presence can slow things down, especially in an already cluttered kitchen or dining room.

The owners recognize that this is just one aspect of their investment. They have also tasked the steering committee with the responsibility of implementing improvements, as observability alone is ineffective without a commitment to continuous enhancement.

To fuel improvements on website performance, stakeholders frequently rely on telemetry. Some services specialize in monitoring the back-end, such as Application Performance Management (APM) tools, while others focus on the front-end, including (Behavioral) Analytics and Real User Monitoring (RUM). These tools facilitate continuous optimization by observing customer interactions but most websites have to select their tools judiciously, as incorporating too many third-party services can lead to a slower user experience.


Switching Plates

To gain deeper insights into customer preferences, the owners implemented a series of tests. Initially, various restaurants within the franchise offered distinct menus, while the head staff analyzed how these variations impacted customer experiences. However, they soon realized that drawing conclusions from a diverse population with varying cultural habits was problematic. Consequently, they decided to conduct the tests within a single restaurant, tasking the Jolly Servants to present different menus to different tables.

Conducting tests to evolve a restaurant’s menu presents significant challenges. Determining which tables qualify for specific menu options requires considerable time, which can negatively impact the overall customer experience. Some regulars may find it perplexing that their menu changes from one day to the next, leading to a sense of inconsistency that adds to the slower service.

A/B tests, mostly orchestrated by JS code, are widely regarded as the most dependable method for assessing how changes to a website affect user experience. However, conducting these tests can be challenging and may result in a suboptimal experience for users during the evaluation period. Web professionals typically advise exercising caution when implementing A/B tests, clearly defining the scope and duration of the tests and ensuring that the solutions are deactivated once they are no longer necessary.


Delegating features

Certain sections of the menu are entrusted to partners with whom the owner has established agreements. For instance, the sundaes will be crafted by a local ice cream parlor. Additionally, some in-house Jolly Servants have been substituted with contractors; specifically, a wine merchant from across the street will handle the wine selection and provide recommendations.

By redirecting the staff’s focus to their core business, the owner has enhanced both efficiency and reliability. However, this shift has resulted in some experiences becoming slower and even riskier, particularly when the sommelier must navigate traffic while crossing the street during peak hours.

The owners now need to monitor their partners. As the nuts and bolts of this partnership, their roles are crucial to the success of the venture.

The use of third-party JavaScript can be very effective in providing services that would otherwise be out of reach or that we know will be better performed by professionals. However, their use requires rigorous control to ensure that the services function correctly and do not encounter failures that could degrade the user experience. Telemetry/Observability services can help with capturing errors and assessing their impact on the user experience.


Chef’s tables

To stand out from the competition, the owners decide that one of their franchises will deliver a unique, signature experience: chef’s tables. Directly at the table, a specialized chef prepares a personalized menu for the guests, based on their preferences, dietary restrictions and the availability of ingredients brought in by the wait staff and Jolly Servants.

Chef’s tables occupy a significant amount of space in the dining room, necessitating frequent movement by wait staff as they gather or replace ingredients. This can lead to delays in starting the meal. Typically, this immersive experience begins with guests enjoying a delightful cocktail while they wait.

Once everything is set up, the table operates autonomously, reducing the demand on the kitchen, which may even become unnecessary. The service provided is both personalized and immediate. However, this exclusive experience is typically only accessible to the wealthiest of customers or those with the biggest address book.

In a bid to elevate their status, nearby restaurants have begun offering chef’s tables as well, including even the fast-food joint just two blocks away. Long waiting times and disappointing experiences result in customers not returning for a second visit.

In the web industry, Single Page Applications (SPAs) are especially well-suited for creating immersive and engaging journeys for users. They often take longer to load, and even longer on entry-level devices so the stakeholders need to strongly think about their engagement strategies and visual tricks for managing waiting times.

Many smaller websites adopt SPAs, drawn by the trend set by larger web players, even when their needs are simple and standardized. This often results in a misallocation of resources, as they utilize a technical stack that does not align with their requirements, and they fail to invest adequately in its proper implementation.


Diverse Websites for Great Experiences

As we conclude this imperfect and incomplete metaphor, it’s essential to recognize that just as there are various types of restaurants, there should also be a diverse range of websites. From the casual indie diner to the exclusive chef’s table, each can offer a unique experience, albeit with its own set of challenges.

Often, the most straightforward solutions prove to be the most effective. However, a lack of personalization can lead to diminished profit margins and hinder the development of a robust brand identity. Conversely, more complex solutions require meticulous consideration of user experience, necessitating significant investments in frustration analysis and ongoing optimizations.

Temporarily downgrading an experience can be a strategic decision aimed at enhancing it in the long run. Investing in processes is essential, and particularly, the implementation of Quality Assurance plays a vital role in mitigating significant risks.


Thanks to Meryem, who put up with my extended metaphor experiments for over a year, and Morgan, Luke and Natacha for read proofing!

Incremental Font Transfer
an opportunity for Asian web fonts

From a French perspective, Asian languages such as Chinese, Japanese, and Korean, along with others that utilize complex scripts, often encompass a broad range of characters. While this diversity is culturally fascinating, it poses significant challenges when selecting a web font. The potential for large file sizes can result in slower loading times, particularly on mobile devices or in regions with limited internet connectivity.

To give you an order of magnitude of the weight difference, this is the latin-extended subset:

Conclusion: the median font file with Latin-extended subset of (395) characters should be a little under 20K. If you look at your network requests and your font is much larger, well there’s work for you to do. ”How many bytes is “normal” for a web font: a study using Google fonts”, Stoyan Stefanov

And this is for Chinese:

Within one Chinese font type, the smallest standard font contains 6,763 characters. A Japanese font type called Hanazono has 87,791 characters. A typical Chinese font file size is usually at least 5MB, some times can be over 20MB. ”Chinese Typographic Design”, Hynuza

As a result, it is common to refrain from using web fonts for web pages that are accessible online in this region.

Optimization is still possible. One effective method is subsetting, which involves creating a “subset” of a font—a file that includes a customized (and typically limited) selection of glyphs. But even with basic high school Chinese, we would need a minimum of 3,000 characters.

I was aware that streaming fonts was not possible, but a recent post from Anthony on the Web Performance Slack caught my attention. He was promoting a new draft specification specifically designed for that purpose.

Without this technology, a browser needs to download every last byte of a font before it can render any characters using that font ”Incremental Font Transfer”, W3C Working Draft

The idea is to create a font face that can be segmented into an initial load, efficiently subsetting what’s critical, then add patches that complete the font along the way. Lazy-loading, but for typefaces.

This initial iteration, once (and if) implemented in the browsers, has the potential to unlock significant opportunities for Asian markets. I’m excited, even if I’m not looking forward to mastering font descriptors such as size-adjust or ascent-override to effectively manage the user experience during the subsequent loading of thousand-glyph patches!

FID is Dead
Long Live INP

It’s official, Chrome ends support for First Input Delay (FID).

FID was unlikely to be a significant concern for many websites. Since the majority of websites effortlessly meet Google’s standards, only a small number of site speed specialists have found it necessary to fine-tune their optimization strategies for this particular metric.

To close this final chapter, I wanted to say a few word.

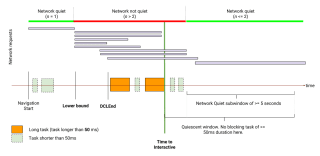
In 2019 the field was notably deficient in a genuine interactivity metric. Time To (Consistently) Interactive (TTI) served as an inadequate alternative, as it merely assessed the final slowdown during the loading phase. This discrepancy left me feeling personally disappointed, as I expressed in my notes, and the poor naming of the metric created more ambiguity than relief.

So when First Input Delay (FID) was introduced, I was very excited. Having the ability to measure actual interactivity latency, even if it only was for the first interaction on the page, was very new!

The initial recommendation threshold for FID was to have “99% of users experiencing a FID under 300ms”. Achieving this was quite challenging, leaving little room for optimizing experiences on poor devices or during the loading of immersive, experiential landing pages.

This recommandation, however quickly aligned with other Core Web Vitals metrics, on the value of the 75st percentile. As a result, First Input Delay lost its relevance, creating space for a more refined metric now known as Interaction to Next Paint.

👋 Bye FID and thanks for paving the way!

Speculative Rules API
a new iteration in the pre-loading journey

In web performance, there comes a stage when you have maxed out all options for boosting the speed of the current webpage. This could be because you have applied all the enhancements you had planned, or perhaps the constraints of your tech stack just don’t allow for more. When you reach this point, your focus will usually shifts to speeding up the load time of the next webpage.

I’ve seen a lot of experiences around this along the years, and I’m looking very close to the new iteration, the Speculative Rules API.

My story of loading the next page

In the early 2000s, when internet usage was time-limited in France, I, as a teenager, used the FasterFox, a Firefox extension that preloaded all possible links on a webpage while I was reading the main content, allowing me to read others pages offline. This was particularly useful for content-rich websites, such as those with song lyrics and video game tips!

Firefox eventually introduced support for the <link rel="next"> tag, which allowed the browser to prefetch a page it predicted the user would navigate to next. I found this feature especially handy for creating multi-page articles on my first blogs.

There was a period when I shifted my focus to .NET and didn’t engage much with preloading (I mostly used Wordpress for content creation, and learned jQuery, then JavaScript, along the way). I returned to it in earnest around 2012.

A couple years later, Alexandre Dieulot proposed an interesting concept: he noticed that there’s typically a 200 to 300 millisecond delay between a user hovering over a link and clicking on it. He wondered if this time could be used to preload the page, so it would be ready as soon as the user clicked. This idea, though it required defining what a preload is (an XHR open) and excluding download links, was relatively straightforward and led to the creation of the InstantClick.io library.

Other libraries followed, offering additional capabilities. The most notable turbolinks. They aimed to provide the same user experience with Multiple Page Apps (MPAs) as with Single Page Apps (SPAs). They leverage Resource Hints capabilities and the then-new HTML5 History API to preserve the functionality of the Back and Reload buttons. It was possible to use both a SPA-like solution and InstantClick, as I did on this blog for a while. However, I eventually decided that the benefits were too slight given the already fast native response time of my blog.

Considering the effectiveness of these solutions and their minimal need for updates over time (InstantClick has barely changed in 10 years), it seemed logical to develop a new browser API that would natively enhance performance for future navigations.

Introducing Speculative Rules API

The Speculative Rules API introduces a new, declarative method for instructing the browser on what content should be prefetched and/or prerendered on behalf of the site designer.

The speculation rules includes a parameter called eagerness that determines when the browser should download the content. Should it do so immediately (as FasterFox did), or should it wait for an additional signal, such as a hover (like InstantClick), or even the mouse pointer moving toward the link?

I find that the rules set by this API are elegantly designed and easy to comprehend. For instance, consider the following example, at the end of <body>:

<script type="speculationrules">
  {
    "prefetch": [
      { "where":
        { "href_matches": "/*" },
        "eagerness": "moderate"
      }
    ]
  }
</script>

Or in the form of a snippet to be integrated into your tag manager (for an A/B test, for example)

(function () {
  if (HTMLScriptElement.supports && HTMLScriptElement.supports('speculationrules')) {
    const script = document.createElement("script");
    script.type = "speculationrules"
    script.textContent = JSON.stringify({
      prefetch: [
        {
          where: { 'href_matches': '/*' },
          eagerness: 'moderate'
        }
      ]
    });
    document.body.appendChild(script);
  }
})()

NOTE
Adding a custom HTML snippet in Google Tag Manager will not trigger the speculation rules. Prefer the JS snippet option.

Tell the browser that for all the URLs in the current domain /*, it can prefetch if it thinks the user is going to need the content. With a moderate eagerness, mostly when the user is going to hover the link.

Is it that simple? It is.

You also have the option to use prerender instead of prefetch. However, let me emphasis that if the prerender rule is applied, it would fetch and process the resource in advance, which includes fetching sub-resources as well, whether they’re from first or third parties.

Should We Hold Your Horses?

First of all, it’s worth pointing out that even though the functionality has been deployed in Chrome for a few months, it’s still new. Certain alchemies, such as the prefetch speculation coupled with a Service Worker, don’t work yet. Nothing dramatic, but caution is the better part of valour.

Speculative prefetching and prerendering, while beneficial for some users’ experience, carries the risk of wasting resources: bandwidth and server resources if the prefetched data isn’t used because the user doesn’t navigate to the prefetched page.

If your goal is to enhance your website’s sustainability or if you’re required to report on it (for instance, due to the European corporate sustainability reporting directive), it might not be the best strategy to artificially inflate the number of pages your servers compute and deliver and your users load.1

From the server side, the use of Speculative Rules can potentially pose a risk to your website. If a rule is too eager, it could trigger a large number of page and resources loads from each user. This increased load could significantly strain your server’s capacity to swiftly deliver content to all users, particularly if you haven’t established caching capabilities beforehand. In extreme cases, this could even lead to a self-inflicted Distributed Denial of Service (DDoS).

Using the Speculative Rules API is therefore not just about enhancing UX, but should be the fruit of an informed decision-making. We can also optimise the rules: as website administrators, we can use behavioral analytics to gain insights into popular pages and user navigation patterns. This information can help us determine whether prefetching would enhance or detract from our users’ experience.

Last but not least, the use of the Speculative Rules API can be likened to a form of user hover tracking. If hovering over a link or dragging the mouse pointer over a link triggers a prefetch or a prerender then all we need to do is consult the server logs to find out what interested a user, or users, whether they visit the page… or not2.

So, do we use it?

The Speculative Rules API is the latest development in a long-standing narrative. The issues I’ve discussed were already inherent in previous solutions. The Speculative Rules API merely incorporates this behavior directly into the browser, which has certain advantages over JavaScript.

Firstly, the browser is better equipped to determine the position of elements and understand user mouse movement patterns than a developer might be. As such, it currently stands as the most effective option for this type of optimization. Secondly, the browser is aware of the connection status and battery level, and can choose not to speculatively load resources if conditions aren’t favorable. If the browser detects that server responses to this origin are too slow, it could also disable this behaviour.

That being said, the public demand for a more sustainable and privacy-friendly web has never been greater. So be careful with your rules and don’t exceed the rights you have over the logs. Keep in mind that the most sustainable resource load is the one that never happened.

  1. Conversely, you might have a specific interest in inflating these numbers. In France, for example, state aid to the press is calculated based on the number of page views. It’s clear that some entities will exploit these rules to “generate page views”, just as some media did before with excessive refreshes. ↩

  2. If the data is processed in this way, it should –at least in the European Union– be subject to consent. ↩

Hear the network

Here’s a good way to raise awareness through audio: Netbeep is a Chrome extension that plays a sound for each network request, depending on the type of content and the domain called. The pitch of the sound is higher for larger files.

A good way to activate synesthesia. By relying on sound rather than sight to convey information that would otherwise be invisible on the screen, this extension enables you to understand how a page is loaded.

On a single page, it’s hard to get much out of it. But when you start using it on several sites, you quickly notice the differences.

If anyone has a Firefox equivalent, I’d be happy to add it to this post.

UX Is Not a Checklist

I was talking yesterday to a customer that was looking for an equivalent to Largest Contentful Paint on Safari.

From an SEO point of view, even if you have a tiny bit of traffic on Chrome, it’s this traffic that shapes the way Google perceives the page’s web performance. But if you want to measure and improve your users’ experience, then I’d say: why limit yourself to LCP?

LCP was created as a proxy measure to answer a much more interesting question: “when do users see enough elements to start interacting with the page?”. And this “enough” depends very page on the page nature and content, and the user’s intentions.

LCP is rarely the best metric to answer this. It’s just the most generic, computable for most pages, by Chromium and Chromium-based browsers, hence perfect for generic, very wide SEO assessment of billions of pages.

[…]

If I’m trying to measure a web page in particular, that I know very well, then I won’t measure the LCP but use custom timings instead. Specific indicators that will best meet the challenges of the page, and help understand how it works:

  • The moment the search input autocomplete is functional and displayed (hopefully in that order)
  • On a Product List, the moment users can see the first line of products and start to interact with filters
  • The moment the loading spinner appears and the moment it disappears to display the final content (useful for both splash screens and funnel interstitials)
  • In a page broken down into components retrieving their content from an API, the specific display times of each component
  • etc.

This is one of the reasons why I feel that Contentsquare’s acquisition of Dareboost has breathed new life into my career in Web Quality. Even more than before, I’ve become involved in usability issues, of which web performance is only a part. It helps me keep in mind that the indicators we measure are often only the most generic and imperfect projections of the technical experience of a web page, and not necessarily aligned with clients and organizations’ objectives.

Last night, I came across Tim’s article that put it very elegantly:

There’s an tendency at times for organizations to treat performance as a checklist of sorts, particularly as we’ve seen the core web vitals metrics bring more attention to performance than ever before. You try to tick the box on those metrics to get them green, then call it a day.

[…]

But none of that matters if those metrics aren’t painting a complete picture of how users interact with our sites.

Performance, like accessibility, is not about conformance.

[…]

It’s about providing a better experience for the people using our sites and applications to make sure they can efficiently accomplish their goals. Doing that requires that we pay close attention to what those goals are, how they are trying to achieve them, and then making sure that the way we measure performance matches up. ”Performance Is Not a Checklist”, Tim Kadlec

As someone who has been involved with Opquast Web Quality Assurance Checklists for many years, the checklist’s criticism obviously resonates with me. But it’s fair. Checklists are just the beginning of a web quality approach, a backbone. It’s a way of doing things right the first time, and immediately reducing exposure to the risk of non-quality. But it’s not a perfect answer to UX, never was and never will be.

A New Product Feedback

When I come up with a product feedback that could lead to a product improvement:

Between what I think,
What I want to say,
What I think I say,
What I say,
What the product department wants to hear,
What it hears,
What it understands,
How the POs conduct the discovery stage with users,
What other users want to hear,
What they hear,
What they understand,
What they express,
What designers want to hear,
What they hear,
What they understand,
What they experience with users to refine the need,
The UX that comes out of it,
How it is communicated to the technical team,
What the technical team wants to hear,
What they hear,
What they are able to implement within the constraints,
The deadlines they communicate,
How they are received by the operational teams,
What the operational teams wanted to hear,
What they understand,
What had to be explained to the sales team,
What the sales team wants to hear,
What they understand,
How they plan to sell it,
What the customer wants to hear,
What they hear,
What they understand,
What they buy,
And the uses to which they will be trained by the Customer Success team…

… there’s still a good chance we’ll have trouble communicating.

But let’s try anyway!

Executions

Friendly reminder that on the web, you don’t control the execution. There are millions of contexts of device, browser, bandwidth, extensions, and support is a beautiful mess… if you don’t measure, you are blind.

Especially, I see a lot of people migrating from back-end compiled-code culture to component-based JS frameworks and never ever question the total absence of client-side logs collection. On the backend, they had a single (segmented and duplicated, but fully managed) execution environment and yet,instrumented it to the bone. On the frontend… nothing.

I’m not saying it’s simple. Privacy is crucial and you’ll need to think about the mechanics of anonymization and the legal (and ethical) best practices of data minimization. But if you don’t, how do you detect errors and ensure that your product works as intended? You also have to weigh the errors that occur against the business impact they can have. Some errors can happen to all users and have absolutely no impact, so you need some kind of knowledge to dismiss them.

I’m talking about analytics only, but also JS errors collections and reporting, and also CSP violations (I’m rooting for report-to to reach a large support pretty soon). And I don’t know Web Assembly enough but I guess we’ll need logs there too!

Buzz, a hand on Woody's shoulder, telling him "Instrument, instrument everything".

Obviously, there’s also a question of ecological footprint. Not only do we ship a lot of JS when, most of the time, HTML and CSS can do the job perfectly but when we don’t measure what happen, we artificially increase our page views… because people reload the page whenever they’re frustrated, or go to an alternative/competitor and load more pages… When you lose efficiency, all of society pays for it.

So: less code, more instrumentation, and a real focus on every signal the real users experience can provide, to optimize their usage so that they don’t have to click twice or reload a page for the content or service to be available. Agreed?

Safe Websites

Today, I audited four very recent sites.

  • one had a server time of ~6 seconds for each resource
  • another had lots of front-end components and absolutely no Server-Side Rendering (SSR)
  • the third one did not work on WKWebView (the engine used by non-Safari browsers on iOS)
  • the last one had a 12 MB image on the homepage

Each of these errors could have been avoided easily. Devs: we should do better. I don’t mean that those errors should never happen, only that we should make sure they don’t happen that much, like:

  • test en staging/preprod environments, with the right devices/contexts
  • adopt a stack that make sense according to the User Experience (UX), not only the Developper Experience (DX)
  • implement controls to prevent common mistakes

So, I get it. You’re building incredible experiences with {insert a JS framework name}. Good for you. I guess it’s fast on your computer. But never forget that if you can’t broadcast this experience to your targeted demographics, you will fail the users.

Because from a user perspective, most websites are commodities, not space rockets. Use standards to create stable, efficient and safe experiences.

"Short" courses

I regularly see sweeping criticisms aimed at people who take short IT courses1, and it annoys me. I’m an ESIEE Paris engineer, IT stream, class of 2007. If I add up all the time I spent coding during my training, it amounts to a few months, at most.

My engineering degree taught me a lot, and I was often aware of the strength this diversity provides in the job market. But I would never look down on people in initial training or, even more often, those retraining, who also know many things besides code and have completed a 3, 6, or 9-month course.

Of course, these courses are incomplete. But wasn’t I pretty incompetent myself when I started? Of course I was. And then I gained know-how, soft skills, and the ability to communicate, all rooted in my experience and skills. And that’s normal.

The quality of my initial training allowed me to get by quickly, without too much pain, and at a time in my life when I didn’t have too many worries. That’s no reason to feel superior; it’s rather an immense privilege.

I admire people who can assess their career, pivot to a new one, and jump into it when they have a mortgage, children, have to pay attention to their relationship, have community investments, or care for elderly relatives, all with far less naivety than I had when I started. They are true heroes.

Can we question how the sector trains (whether for retraining or not)? Yes, absolutely. I’ve trained people myself, and I know how programs are designed in many schools: to feed the biases of students’ parents.

Do short courses do better? No. They also sell an unrealistic time-to-market and exit salaries that are often grand promises. But that doesn’t mean people don’t graduate as competent as other juniors.

Is it a problem that people are juniors? I don’t think so. I believe many people can come to coding late, or superficially, and that’s okay. They’re not stealing anyone’s job. They get a job with their skills.

Is this what companies want? Perhaps not. And that makes it very hard for these new people in the market. Many are impoverished in statuses that make them bear the risk of their employment, at derisory daily rates.

Don’t companies have a role to play in this situation? Certainly. Few are inclined to hire these profiles because they don’t want to bear the cost of training these employees.

They end up demanding training during employees’ free time, even though they may have a legal obligation to keep their employees up to date for their positions (this is how it works in France). But honestly, at this level, it’s a culture of the entire development industry where the perception of skill development needs to be re-evaluated. We are often treated as clients of our own companies, responsible for our training with the leverage of looking elsewhere if we’re not happy.

This turnover dynamic means companies continuously hire juniors to perform tasks that now-senior people used to do, but no longer do since they’ve left to seek recognition elsewhere.

And since these companies need to replace identical profiles, they will naturally hire people who resemble those they had before, leaving little room for people in retraining (or for women if there are already few women in place).

None of this is the fault of the training programs; we should realize that. Training programs have their flaws (seriously, when I see web courses that don’t teach the basics of HTML, I cry), but this issue of matching trained profiles to company needs is a systemic market dynamic.

  1. I refer you to Medhi’s excellent article on development training. ↩

You should look into WebPerf

Dear fellow web professional, you should be interested in Web Performance. It’s a topic that is at the heart of the web, which needs specialists, and is booming. I know you don’t believe me, or that you think that this is not easy and you’re right. So let me tell you where we stand. and why we need you to join us.

Note: this post first appeared in the Web Performance Advent Calendar.

I have been doing Web Performance, or webperf, for more than ten years. I have spoken publicly for the first time in 2012 1. I was suggesting that it was necessary to approach the subject in four steps: first become aware of the stakes, then learn to optimize, monitor performance and finally, engage internal discussions about it internally in order to avoid future damage.

Eight years later, I still think it’s the best way to approach the subject. But around me, people don’t necessarily talk a lot about web performance. For all those who have not necessarily followed where we are, let’s take a look at the subject.

The field knowledge is dense, but my goal is not to stifle you with information. If you want to go further, you’ll find lots of footnotes leading to additional readings.

A status update

Let’s start with some definitions.

Webperf is all you can do to make your site be feel as more efficient by a user. You start from the user experience of your site or web app (including animations), then you explore the underlying layers: HTML, CSS and JS code, the server configuration and finally an analysis of the infrastructures and third party services that you allow yourself to use, and their configuration.

Since a high-performance site consumes less energy, web performance shares 90% of its DNA with eco-design. But some good web performance practices, such as the use of CDN, are not compatible with ecological considerations 2.

It is usually implied that a faster application is more satisfying, but with web perf, we have figures that confirm it. Many brands have commissioned optimization projects and testify to the gains obtained, especially on the conversion. WPOStats.com provides case studies and experiences demonstrating the impact of web performance optimization on user experience and commercial success. This is an essential aspect because it means that webperf is an area of web quality whose return on investment is provable. As a result, investment is facilitated.

Optimising web performance is a skill, and by recognising that skill with the appropriate compensation, there is a better chance of attracting talent to this area. There is a good dynamic in the community, which is nourished by articles on different expertises within web performance. It helps the whole community to grow.

Vitaly Friedman’s “Front-End Performance Checklist” is one of the most comprehensive resources. It’s an in-depth review that is updated annually in Smashing Magazine. The problem is that you can’t simply point anyone to this kind of file: 53 pages resulting in a 13-page operational checklist 3 is not within everyone’s reach: it’s a high barrier to entry.

To get to the heart of the matter faster, you can use one of the many analysis tools and services available in browsers or as services. These tools, called “synthetic” or “lab” tools, are very useful: they analyze a page load and instantly produce a contextualized audit report that helps you target the essential, potential issues 4. They can often be used to perform tests with custom constraints. You can make assumptions like “I think this JavaScript script execution slows down the page rendering”, and then confirm it by blocking this file and seeing if the display really happens faster. You can also easily measure the performance of a page against the same page of competitors’ website.

But the strength of these services is also their weakness: they only measure what they are asked to measure. They can’t tell if the sites are fast for people. If you need to get this information, you will have to turn to analytics or real user metrics (RUM). The analytics services you already use, like Google Analytics, may track sufficient web performance Real User Metrics (RUM) 5, but to go further in assessing user frustration, you will have to turn to more elaborate solutions 6. However, you’ll often need to get your hands into your code to implement this.

However, if your website is public and receives a lot of visits, you can use field data collected by others. These datasets are handy, because they are accessible without installing anything on the sites and therefore, as with synthetic tools, you can make comparisons between sites. The data is not necessarily difficult to retrieve, but may be incomplete (for example, only reporting the performance of Chrome’s users, not the other browsers 7).

It can often take time to understand field data. Interpreting the results is very complicated because many factors can affect the measured performance 8. If you have a hunch about something, see if you can validate it by cross-checking with other data, or through synthetic tests.

In a nutshell

Today, the technical knowledge on web performance is largely consensual and testable via automated analysis tools. Generic field data is relatively easily accessible if you know where to look, and provides feedback on the implemented optimizations, the cost of which is easy to finance and the gain to measure.

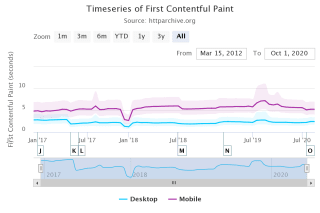
And yet… if you look at the field data, you can see that the performance of most sites isn’t really improving, for example looking at First Contentful Paint, one of the well-known metrics for measuring when the page starts becoming useful, we see no real change over time:

Evolution of the First Contentful Paint metric from January 2017 to August 2020, measured in Mobile and Desktop contexts. In both cases, fluctuations are present and often correlated between the two contexts, but overall, the average value shows little variation or even deterioration.

Evolution of the First Contentful Paint metric from January 2017 to August 2020. Source: HttpArchive

This means that the situation must not improve, as you may think. Let’s take a little tour of the things that are still difficult.

The road ahead of us

Like many web quality topics, web performance is everyone’s business. To improve the performance of a site, you must not only understand where problems come from, but also be able to determine who are the right people to contact to solve them. Since webperf concerns all the aspects of the web, you will soon find yourself having to talk to very different people. Even on seemingly simple issues.

Let’s take the example of image optimization. When you say it like that, it sounds simple and a lot of people will feel like they understand. But in order to approach the topic in its entirety, you have to:

  • Train people to choose the best format based on the image
  • Control the addition of images and trigger the optimization and generation of several image variants depending on the context and artistic direction, to avoid oversized images
  • Modify the HTML markup and/or possibly set up an image proxy with content negotiation (internal or external), so that every user receives an image adapted to their own context.

And I haven’t even talked about lazy loading yet.

When you start talking about web performance in the enterprise, you’ll quickly find, the hardest part is not necessarily the technique: It’s also about getting different professions to talk together to get an overview of the situation and the actions to be taken.

This is especially true, since it is sometimes difficult to talk about the same thing. There are really a lot of different metrics and as if that wasn’t enough, new metrics appear regularly. There are some metrics that have been used a long time, such as the Speed Index 9, a reference indicator for almost 10 years. Others are misnamed, or do not allow for decision-making, or inform about something that is not necessarily paramount. It is therefore necessary to constantly question not only the metrics themselves, but also the way in which they are measured.

Often the best way of addressing your own, specific needs is when you use your own metrics using customized time milestones. On the server side, these are called Server Timings 10. On the browser side, these are called User Timings 11. Contrary to other metrics, they correspond to what your team chooses to monitor. You can find them when you analyze the page in your browser’s development tools and they are collectable by all the analysis tools. Why not use them?

When you want to optimize the performance of a site, you will sometimes come up against external libraries used by others to meet business needs. These libraries often address the business need in terms of functionality. but often do not consider their impact on web performance. As a result, the people who use them sometimes have never heard of performance. And require extra work to ensure they do not impact on performance.

Concretely, it often means that optimization is going to be difficult, technically or because the people you’re going to talk to won’t understand this need. When optimization is really impossible, don’t forget to write it down in a technical debt repositoryso that it can be considered in the next sprint or redesign.

Why we need you

The subject of Web Performance, like many subjects of web quality, is a technical subject. But the knowledge is available and the skills can be learned with time and investment.

I’m not going to lie to you: it takes a long time to become proficient. But the acquired skills often do not depend on any framework, any solution on the market, any trend. It’s all about understanding how web standards work: HTTP, HTML, JS and CSS. It’s hard to learn anything more reusable on the web and believe me: it’s worth it.

You will see that whatever your role in the web production chain, you can acquire these skills and put them at the service of better web performance.

We need people ready to optimize websites – there is a real demand for this. But it’s far from being the only way to participate, in fact it’s often at the end of the chain.

To begin to understand the challenge, we need Data Analysts capable of assessing usage data and refining metrics, to better balance between investments and gains. Knowing that a topic is relevant because others say so, is not the same as being able to adjust one’s investment according to one’s needs and savings.

Web Performance must be an integral part of the development of libraries of all types. Whether it is back-end or front-end, these projects must integrate performance as a fundamental need, in the same way as security or accessibility should be.

We need designers who think about the way their interfaces are progressively displayed and prioritize the elements most expected by users in order to improve their experience 12.

Are your skills more related to back-end? Great - we also need people like you to optimize code execution, set up server caching systems, or help develop edge proxies with a real-time optimization engine that can help optimize a site quickly while waiting for underlying fixes to be made 13.

Finally, we also need people to “mediate” all these professions, to nurture and supervise dialogue, to provide the conditions for success and in particular training in a “common base of competence” (using something like Opquast 13, for example).

For all these reasons, you should look to improve web performance.

And, maybe, you already do it.


The illustrations in this article are from the Undraw project, created by Katerina Limpitsoun. You can use them in any project, commercial or personal, without attribution or fees.

Thanks to Barry Pollard who took the time to rewrite a good third of the article in an English that is a little more understandable than what I produce myself!

  1. “Mettre en place une stratégie de performance web” during Sud Web 2012. ↩

  2. Romuald Priol talks about it very well in his post “The digital impact: best practices for a greener web”. ↩

  3. “Front-End Performance Checklist 2020: the PDF”, 166 Ko. ↩

  4. Dareboost, which I work on, is one of those tools and I’m very proud of it, but it’s far from being the only one. Calibre, Speedcurve, GTMetrix, Pingdom, among others, also offer instant reports and tracking. Development teams can also use Lighthouse or WebHint on their computers. ↩

  5. For example, Google Analytics. Personally, I use Matomo. ↩

  6. About this, see “User Experience & Performance: Metrics that Matter”, by Philip Tellis. ↩

  7. I’m talking about the Chrome User Experience Report, also known as CrUX. ↩

  8. “Comment interpréter les mesures de performance réelles (RUM metrics)”, by Gilles Dubuc. ↩

  9. “Speed Index: what is it and how to properly use this performance metric?”, by Damien Jubeau. ↩

  10. “MDN Server-Timing Documentation”. ↩

  11. “Custom Timing: attendez la prochaine frame quand vous utilisez la User Timing API”. ↩

  12. See “Mind over Matter: Optimize Performance Without Code”, by Stéphanie Walter. ↩

  13. Opquast, the benchmark certification for all web professionals. ↩

Cumulative Layout Shift, The Layout Instability Metric

Have you ever started reading an exciting news article but then lose your line because all the text shifted downwards? This happens to me a lot, mostly because of ads loading around the content I’m reading.
This kind of user experience can be frustrating, but until now we’ve had trouble measuring it quantitatively. Cumulative Layout Shift addresses this challenge.

Note: this post first appeared in Dareboost’s Blog (discontinued).

When you see a web page, you automatically break it down into visual elements. You perceive their relationship to each other according to their arrangement on the page. This is how you can identify where the relevant content is located. If this content moves by itself, or if another element is injected into the layout and moves the others, then you may lose sight of what you are focusing on.

LeMonde.fr Home page load. Inserted and moving contents are identified by light blue areas. The contents of about 2/3 of the screen moves during the page load.

And it’s even worse if you thought the layout was stable, and you were about to interact with the page. For example by clicking on a button (image on the left). If other content appears right before the click and pushes the other content downward (image on the right) you might interact with the wrong element of the page.

Two images of a user holding a phone in their hand. In the second image, a tap is implied.

Within a product listing, the user is about to click on an image of a chair, when suddenly a text insert appears, shifting all the content downwards. The user unintentionally clicks on an image of a backpack.

Overview

In this article, we will discuss the Layout Instability API and its use to compute the Cumulative Layout Shift (CLS). We’ll see how to visualize CLS in Chrome and how to optimize for it. Finally, we will address some of its unusual characteristics and conclude.

A Dedicated In-Browser API…

Viewing the elements that are shifted when loading and while using a page has been a long-standing need. A decade ago, you would need a custom-configured rendering engine (in the following example, Gecko, the Firefox rendering engine) to show every paint reflow.

Caution

This video contains lots of repaint. Don’t play if you are photosensitive or have vestibular disorders.

In Chrome today, you can use the Layout Instability API. Its original intent was to find more relevant signals than the onload event to determine when a page is loaded. Layout stability, or “lack of shift” was one of them. As stated in the API abstract, it “provides web page authors with insights into the stability of their pages based on movements of the elements on the page”. To do that, the API monitors the position of the visual representation of every node that is visible in the viewport. If a node’s visual representation shifts from the previous frame by 3 or more pixel units in either the horizontal or vertical direction, the API notifies a layout shift and scores it.

… Used To Penalize Jank

Let’s go back to our example:

Two images of a user holding a phone in their hand. In the second image, a tap is implied.

Within a product listing, the user is about to click on an image of a chair, when suddenly a text insert appears, shifting all the content downwards. The user unintentionally clicks on an image of a backpack.

How does the Layout Instability API score this? To compute the layout shift score, the algorithm first evaluates the area affected by the shift and multiplies it by the length of the shift.

The area affected by the shift, or impact fraction, is the total area of the moved node, from its first position to its final position. Here, 78 % + 32 % = 110 %. As you can see, the impact fraction can be greater than 100 % (the viewport size).

The length of the shift, or distance fraction, is measured according to the viewport’s largest dimension. So in this example, we’ll consider the height. The existing element moves by a height equivalent to 34 % of the height of the viewport.

In this example, and for this particular layout shift, the layout shift score is:

layout shift score = 110 % (impact fraction) × 34 % (distance fraction) = 0.374

The Cumulative Layout Shift (CLS) metric is the sum of (nearly) all individual layout shift scores.

The 500-millisecond window

To prevent websites from being penalized for transitions or animations that are the result of user interaction with the interface, the CLS algorithm does not record the layout shift for 500 ms after each active user interaction with the document (e.g. clicks, type, tap), or any event that directly changes the size of the viewport. We can consider that such shifts, resulting from an action, are expected by the user.

According to Google, to provide a good experience, sites should strive to have a CLS of less than 0.1 for most (75%) users. This is bad news for the developers of the above example!

Keep in mind that the impact fraction and distance fraction are highly dependent on the viewport’s characteristics. A change in your viewport’s dimensions or even orientation can change your layout – adapting responsively to the available space. Thus your impact fractions,distance fractions and, in the end, your Cumulative Layout Shift will change.

How To View Layout Shifts in Chrome

Layout shifts can be displayed in Chrome.

  1. In the DevTools, open the Command Menu with Control + Shift + P or Command + Shift + P (macOS)
  2. Start typing ‘Rendering’
  3. Run the “Show Rendering” command.
  4. Enable the Layout Shift Regions checkbox. As you interact with a page, layout shifts are highlighted blue.

Warning

As stated above, this feature may cause flashing. If you are photosensitive or have vestibular disorders, use it with caution.

Since Chrome 84, you can also visualize Layout Shifts and get information about their attribution (even down to the shifted nodes) in the Performance tab, on the ‘Experience’ line.

A screenshot of the DevTools Performance tab, when zooming and selecting a layout shift.

On a timeline, a succession of screens helps to understand the visual sequence. Below, several lines expose what happened at the same time, including the Experience line, that contains red inserts, one for each Layout Shift. At the very bottom, a description gives more precise information about the selected Layout Shift.

How To Optimize Your Cumulative Layout Shift

A page accumulates layouts shifts throughout its use. Each time new elements are visually inserted without the necessary space to display them being reserved by the browser. These insertions will often be images, but you also have to be careful with ads, web fonts, embedded content, and contents injected following an interaction that generate waiting times of more than 500 ms.

Images

When it receives the HTML code for your page, the browser doesn’t know much about the images used in it. With no more information than the URL of an image, the browser does not know its size, so it cannot allocate the proper space for the image to display. This has become even more complex since the advent of Responsive Web Design. The display size of an image often depends on the context.

To give as much information as possible to the browser so that it can do its job to the best of its ability, always set a width and a height attribute on your <img> tags (in pixels). Even if these are not the actual display dimensions (which may depend on style rules), the browser will use them to infer the width / height ratio (called aspect-ratio) of the image, and thus calculate the height to be reserved based on the display width defined by the CSS.

Did you know?

Edge, Firefox and Chrome have an internal mapping of aspect-ratio for images that defines both width and height attributes. An experiment is ongoing on Chrome to open the feature to developers.

.el {
    aspect-ratio: 16 / 9;
}
/* internal rule for img, using the --webkit prefix (in Chrome)
img[width][height] {
  --webkit-aspect-ratio: attr(width) / attr(height);
}*/

Learn more about aspect-ratio with Chris Coyier, on CSS Tricks.

And of course, remember to serve the right file size regarding the context. Use srcset to help the browser select the best image in your image set with the same aspect ratio (this depends on the rendering width). Use picture and source for different aspect-ratio or different image formats based on the context and browser support.

Ads, embed, iframes, and on-load dynamically created content

As with the images, the browser needs to allocate the appropriate space to render the final content. But you can’t give much info to the browser, as you have yourself little information about the future content. In the following I will only talk about ads, because they raise the most challenges. But the mechanics are the same for the other types of injected content.

In the following, we will discuss the impact of content injections on the main page template. It’s worth noting that if an iframe produces CLS within itself, it does not impact the main page.

More often than not, advertising space is allocated to a bidding service that injects a container into a dedicated node. Then, this space is ‘rented’ to the highest bidder, allocated to a network that then injects an advertisement. The space may be resized several times before the final ad is displayed, and in the case of timed ads, additional injections may occur multiple times during the users session.

How to prevent layout shifts from happening?

Explicitly define the space allocated to the ad container. If the ad is smaller than the allocated space, plan a background cover that will skin the available space. If the advertisement is larger than the reserved space, some of it will not be displayed.

Sometimes no advertising fills the area. Plan for visuals of the correct size so that you don’t have to collapse the advertising space and provoke a layout shift. If your network provides you a way (through a JS callback, for example) to inject useful content in the absence of advertising, of course, do not hesitate.

Another way to solve this problem is to position the ads in the negative space left by the content of the site, out of the page flow. If your ad has a fixed position in the page template, and that position does not interfere with the flow of the rest of the content, then inserting the ad does not cause any shift.

A capture of a page from LeMonde.fr where a space is reserved for an advertisement in the margin. If the advertisement is larger than expected, it takes up more space in the margin, but does not shift the content.

Using negative space to position ads.

You can also move your advertising slots lower down on your pages. This will prevent the layout shift impact fraction from being too large, but this will likely reduce your revenue.

Web fonts

When a browser needs to display text with a web font, it identifies whether the font is needed and available (on the system or in the browser’s cache). If the font is necessary but unavailable, then the browser fetches it. During the fetching phase, the browser follows the font-display instructions (or lack of) to determine whether it should render the text with a fallback font or allocate the space with invisible text. When the font is available, or if the waiting time is too long, then the browser proceeds with the final rendering.

In other words, whenever the browser has to fetch a font, it allocates the area with text using a fallback font, visible or not. And when the font is finally available, the browser renders the text area again using the web font.

However, the temporary font does not necessarily have the same characteristics as the final one. Baselines, point sizes, kernings can differ and the final text may appear shorter or longer than the temporary text, causing layout shifts.

Every time I need to remember how font display management works, I go back to the font-display playground, by Monica Dinculescu.

To avoid these layout shifts, you can speed up font loading. You can also choose web fonts with characteristics similar to system fonts, or consider the web font as optional the first time the page is loaded. It will then not be used on this page, even if downloaded and cached. Instead, it will be available on the next page. You can read more about this in ‘eBay’s Font Loading Strategy’ by Senthil Padmanabhan.

Content injected more than 500 ms after an interaction

The CLS algorithm ignores Layout Shifts for 500 ms after each active user interaction with the document or change in viewport size. Thanks to this behavior, most user interactions do not cause layout-shifts that are recorded in the Cumulative Layout Shift.

But you have to make sure your UI will react to the user interaction within the 500 ms window. If your UI relies on network requests or heavy javascript processing, shifts might occur after 500 ms and will so be taken into account in the Cumulative Layout Shift value.

To optimize your CLS:

  • Make sure that your transitions and animations that follow user interaction last less than 500 ms.
  • Measure and optimize your APIs response time.
  • Anticipate the result of the network call(s) or long treatment by allocating the result area during the 500 ms, even if it is to be filled later on (you can use an optimistic UI pattern).
  • Implement a specific UI paradigm for long processing and network call (queuing and completion notification system, modals etc)
  • Only animate CSS properties that do not trigger layout changes in Blink.

Of course, always test. While conducting some experiments to write this article, I discovered that layout shifts are created when the duration of a translate transition is 0 (this is fixed now). Edge cases like this will always exist. Please report them to the Chromium Team.

Tip: two-step processing

Take the example of a “Load 20 more articles” button at the end of a page. If the processing (aka network call + rendering) takes less than 500 ms, no problem. But if it takes longer than 500 ms, the rendering may cause the footer to shift and increment your Cumulative Layout Shift.

To avoid this, you can monitor the elapsed time and split the task in two parts if need be. Instead of rendering systematically after the network call, you can change the button label to “Show all 20 retrieved items”. This will force users to interact again with the page and grant you 500 additional milliseconds for rendering the content.

Of course, do not hesitate to ask the users to check if the use of the functionality better meets their needs. Optimizing the CLS should not be at the expense of the UX.

Counter-intuitive behaviors

Continuous accumulation in Single-Page Applications (SPAs)

While most performance indicators are related to the loading of the page, the CLS is focused on the whole experience of loading and interacting with a website.

Many websites are structured on a page to page, URL to URL navigation paradigm. For them, the CLS is reinitialized with each navigation. Some sites, on the other hand, are built around a single page the content of which evolves through interactions, through JavaScript. These are called Single-Page Applications (SPAs).

On SPAs (including applications that use progressive enhancement turbolinks-like libraries), the Cumulative Layout Shift may never stop increasing during a user’s sessionsession, as the navigation between contents is not achieved by navigating between pages. The Cumulative Layout Shift will only be collected when the user leaves the page. If the Cumulative Layout Speed value you see in the Search Console (in the ‘Core Web Vitals’ section) seems high, maybe that’s an explanation.

Note

This specific point about Cumulative Layout Shift is particularly important. As it means that the goal of SPA developers should not be to reduce the number of layout shifts, but to design interfaces that don’t produce any layout shift at all. If they don’t, the more popular their interfaces are, the longer the session durations will be, and therefore the higher their reported CLS will be.

Scrollbars appearance penalty

This may seem counterintuitive to some, but horizontal and vertical scrollbars are part of the viewport. A great example of this is they’re included in the viewport-percentage length such as vw or vh. This implies that the appearance or disappearance of scrollbars does not modify the viewport size even though it changes the area available for content, and causes layout shift.

Unfortunately, on some Operating Systems, like Windows, scrollbars are hidden until they’re needed, which can lead to a scrollbar missing from First Paint, then added later during the page load, and that may cause layout shifts.

To avoid this behavior, you can add html { overflow-y: scroll } to enforce a scrollbar at First Paint, or wait for the implementation of CSS Overflow Module Level 4 and the new scrollbar-gutter property.

Impact of the timing-function

In the following example, we compare two flex arrangements. In the first one, the central element doubles in size when hovered, using an “ease” timing-function. In the second example, a “linear” timing-function is used.

As you can see, the second example generates much less Cumulative Layout Shift. To explain this, we need to go back to the Layout Instability API spec, and more precisely, to what is called “Unstable nodes”.

A Node N has shifted in a coordinate space C if the starting point of N in C differs from the previous frame starting point of N in C by 3 or more pixel units in either the horizontal or vertical direction.

This “three pixels between two frames” rule introduces a speed criterion in the instability measurement. All elements moving below this speed are not considered unstable, and these animations do not produce a layout-shift.

Unfortunately, this means that to reduce CLS, some site owners might be tempted to use linear animations, which have a constant speed, rather than ones more intuitive to humans, such as “ease”, that speeds up at the beginning of the animation and slows down at the end.

The linear and ease functions, represented by bezier curves.

The linear function has a constant growth. The ease function accelerates until the middle of the time, then slows down.

Other strange behaviors of the metric

  • Animated elements that create layout shifts may continue to do so if they are not visible to the user (for example, even with a color that blends with the background). But if you use visibility: hidden, they won’t.
  • The web.dev CLS page recommends using transform and translate to create animations that do not produce layout-shift. However, a bug in Chromium seems to create layout-shifts when the transition time is 0 in Chrome, until version 86.

Conclusion

Cumulative Layout Shift is a metric that measures the layout instabilities of a web page. To optimize it, and improve the user experience, you should avoid injecting content for which the browser has not allocated the right amount of space. There are several techniques that exist for images, but this will, however, make advertising management much more complex.

The way the CLS is calculated results in some unusual features. The current algorithm of CLS is probably not a good fit for Single Page Applications, as the attribution of results at page-level is not properly handled. Thus, Core Web Vitals as a ranking signal might be particularly challenging in such cases.

Keep in mind that CLS is a new measure. We still lack feedback at scale. When in doubt, always focus on improving the User Experience instead of the metric itself. Some CLS optimizations may work against this goal and should be avoided.


Browser Support

Steve Kobes announced that Blink (the Chrome rendering engine) intended to implement such an API in October 2018. Work on the draft Layout Instability API began in May 2019, and the API released with Chrome 77 in September 2019 and later in Edge (80+). Daniel Holbert created a ticket for Firefox in July 2020. We did not find any mention of the Layout Instability API in Safari’s public ticketing platform.

Resources


Thanks to Damien Jubeau and to Matt Hobbs for their contributions and for helping me improve my English!

Punishing Loyalty

Let’s imagine that you deploy on your site a consent collection mechanism tied to your Terms and Conditions of Use (TC). This consent is generally structured around different purposes: consent to telemetry, consent to advertising, consent to the transmission of information to third parties…

If you want to finely measure the impact of these different “levels of consent” on Web Performance, then you need to look at all the use cases, depending on the relationship the subject has with your site.

To measure the performance of these uses cases, you’re going to need either Real User Metrics, or Synthetic Monitoring solutions. Most tools will ignore the cookie banner and so test without loading those extra dependencies, so you’ll need to configure your tests so that they start with a specific configuration (often a cookie) to reproduce all the use cases:

  1. The user blocks the consent request script (via an adblocker, for example).
  2. The user has given their consent to this version of the TC.
  3. This user has given their consent to a previous version of the TC, you need to ask for their consent again.
  4. The user has explicitly refused their consent to this version of the TC.
  5. The user has explicitly refused their consent; you could ask for their consent again (at your own risk).

Case number 3 can give rise to a significant amount of testing as you should ideally test all consent combinations: “telemetry”, “telemetry + advertisements”, “advertisements only” .

To simplify, you can focus on the two most extreme use cases:

  1. What happens if the user refuses or does not consent?
  2. What happens if the user consent to all usages?

Very often, the acceptance of all uses leads to a situation where the user experience is disastrous, and users are not offered any new feature to compensate for this degradation of their experience.

This is an opportunity for Product Managers to reflect on the ethics of this type of implementation. Is it normal that we offer the most degraded experience to our most loyal users?

This reflection may result in a transformation of the offer, either towards a model where loyal users are rewarded for their sacrifice (by gaining access to features that are only available to those who accept third parties data collection), or towards a paid model, more protective but less accessible to all.

Philosophically, we then enter into very up-to-date considerations on privacy as a capital or as a common. A fascinating subject.

Self Restraint

Sometimes I write a tweet or a blog post and then I delete it.
Because the world doesn’t need it.
Because it can hurt some people.
Because there are other ways.
Because I can live without publishing it
and my followers deserve that I don’t.

Please do the same with your JavaScript.

How to Optimize Third-Party Services Performance

Embedding an existing library or service as a third party can increase productivity, but often has a cost on perceived performance. Once you embed external code, how can you ensure that this code will not affect the performance and interactivity of your site? Here are some ideas for a more efficient third party code.

Note: this post first appeared in Dareboost’s Blog (discontinued).
A white water swimming race. No lanes, all the participants rush to the finish at the same time, even if it means colliding.

If nothing distinguishes your resources from third-party resources, they compete with each other.

Building a Front-End Web project is about fulfilling a set of business requirements through code. You can produce this code yourself or transfer this responsibility to libraries or services that have already proven themselves on the market.

When you reference one of these libraries or services from a web page rather than embedding it in your code, neither you nor the browser of the visitor has control over this resource, since it is produced, managed and hosted by a third party vendor. These are called “Third Party” (or “3p”) resources.

How does it work?

Using third-party resources, in HTML, is usually done through the <script> tag (which allows you to load and execute a script), <link> tag (which references resources later needed by the page) and <iframe> tag (which creates a completely different navigation context within the page). They are very commonly used.

According to the Web Almanac 2019,  93% of desktop pages include at least one third-party resource and nearly 76% of these pages query an analytics domain (such as Google Analytics, for example).

Third parties can concern a wide variety of areas: advertising, analytics, customer relationship, social network integration, marketing, user management, videos… Very often, references to these resources are gathered in a tag manager, which centralizes their management and provides an entry point for discussions about the third parties used on the page.

Using third parties increases the productivity of your development teams (who delegate some features to these third parties). On the other hand, this will increase your operational cost, since you may have to pay for a software license, and most certainly monitor the proper functioning of this software component that you no longer have control over.

Note that you generally cannot request any changes to the way the third-party resources or services you use work: the fact that these resources are used by a very large number of sites means that the publisher is sheltered from individual pressures.

What about performance?

While often criticized, third parties have an impact on rendering and usage performance that it is important to balance. If we take, for example, the most common JS libraries, served as third parties by CDNs: they are among the most efficiently delivered resources, with efficient minification and obfuscation, often coupled with low-latency CDNs. Although their use often degrades the Start Render, this is more often because these scripts are loaded synchronously rather than to their third-party status.

The biggest impact on performance comes from ads and social network scripts which cost on the network and performance is rarely outweighed by the features they provide to users, at least during the initial page loading phase.

One example is Facebook’s “Like” button. Its interest from a user experience perspective is debatable, and it is certainly not relevant until the user has seen the content of the page. You should therefore always load it “lazyly” (late, in the process of loading the page).

Quite often, once you have assessed the relevance of your third parties and their respective loading modalities, you will certainly discover that the way you load your third parties can be optimized.

Delaying a resource or service loaded too soon.

When a third-party resource (or several) is loaded before all the critical elements of the page have been displayed and became interactive, you may want to delay them. An example would be the loading of Youtube videos, located below the fold, consuming bandwidth even when they are not visible.

In this case, it will be necessary to revise the declaration of the <script>, <link> or <iframe> responsible for the inclusion of the third party resource in the site, so that this inclusion occurs later, deferred: either in reaction to an event raised during the loading of other resources or after an event provoked by the user (an issue of Lazy-Loading already discussed for the loading of images).

Prioritizing a resource or service that is too late in the queue

If you are using third parties to define or improve the design (fonts, JS scripts that define the dimensions of elements in the layout), or even to retrieve part of the content to be displayed, you will want to prioritize their loading and usage. However, very often, the use of these resources is slowed down by:

  • the DNS resolution of the origin that hosts them
  • the connection to this origin
  • the downloading of these resources

How to tell the browser the behavior to adopt to optimize their loading? Have a look at my previous article on Preload and Resource Hints!

The Googles Fonts case

When it comes to web fonts, Google Fonts are predominant: according to the Web Almanac 2019 (“Fonts” chapter), at least 74% of web font requests come from Google Fonts, and 29% of pages contain a link to a Google Fonts CSS style sheet.

This type of request presents a real risk because the loading of a CSS stylesheet is synchronous. The browser interrupts the rendering of the page while it requests, downloads, and analyzes the CSS file. The request represents a Single Point of Failure (SPOF): if there is no response, then the page remains frozen. It is very easy to simulate such a failure with Dareboost (targeting fonts.googleapis.com).

To mitigate this, you can use asynchronous loading techniques based on attribute alterations or JavaScript libraries that expose the life cycle of your fonts.

A simpler optimization is to download Google Fonts. A feature offered natively on the Google Fonts site but also available via Mario Ranfti’s Google Webfont Helper tool which will help you generate the CSS file to declare them.

By doing so, however, you will lose the benefit of Google Fonts content negotiation, detailed in this article by Barry Pollard. In short: Google Fonts optimizes the CSS file it delivers to provide the right font formats and character sets for the requesting browser.

At the moment, the best solution may be to use a resource proxy. On the surface, these are your sub-domains that serve the third-party resources you need. Under the hood, they are web applications that perform resource fetching and caching on external domains, filtering the information sent to those domains ( forwarding what is relevant for content negotiation but not privacy-related data). With such a tool, you serve fonts from your domain, while benefiting from Google Fonts content negotiation. This technique, also available for JavaScript scripts, is well described in this article from Decitre Tech team: “Limiting the damage of third party JS loading [FR]”.

Cette technique, complexe, n’est pas à la portée de tout le monde. Une alternative est donc d’utiliser un mélange de preload (pour la feuille de style CSS) et de preconnect (au domaine servant les polices) pour bénéficier de la meilleur optimisation possible. Harry Roberts traite ce sujet en détail dans un article paru aujourd’hui-même: “The Fastest Google Fonts”.

Conclusion

Third-party resources or services provide features to your site, but the way they are loaded may negatively impact the user experience. To optimize their usage, start by determining the tradeoffs that need to be made to prioritize each item. Once these priorities are determined, then you can delay or prioritize third-party loading to get the most out of it, sometimes by delivering them through your domain (first-party), either directly or through a proxy.

Preload, Prefetch and Preconnect: Speed Up your Website with Resource Hints

Loading a web page requires fetching a whole set of resources which collectively allow the page to be displayed and interacted with. To increase the user’s perception of speed, you may need to influence the order in which these resources are fetched and executed. And that’s where preload and Resource Hints come in.

Note: this post first appeared in Dareboost’s Blog (discontinued).
A swimming race

Need to alter the priorities set by the browser? Act with caution.

A web page consists of a main HTML document and optional additional resources designed to format it, add media, or behaviors. According to the Web Almanac  2019 (chapter “Page Weight”), more than half the pages contain more than 68 resources added to the main document.

Hence we can assume that under normal circumstances, downloading a resource is a recurring task for the browser. This task can be broken down into several steps, including:

  • Resolve the DNS of the resource’s origin
    (if necessary, i.e. if the browser has not already done so);
  • Connect to the origin server
    (if necessary, i.e. if the browser is not already connected);
  • Fetch the resource
    (if necessary, i.e. if the resource is not already in the user agent cache and still valid);
  • And – according to the type of resource and the reason for which it was fetched – its evaluation and use.

For the browser to download resources more efficiently, you can indicate how to optimize these different steps.

You can even tell (ask?) the browser to download some resources in advance, to improve future browsing experience on your site.

The directives and how to use them

To leverage resource loading, you can use preload, dns-prefetch, preconnect, and prefetch. We’ll call all of these directives “Resource Hints” in the following, but be aware that preload has its own specification, while the other Resource Hints are defined in a separate specification, mostly because `preload’ is not just a hint to the browser, but rather a command.

To write these directives, you can use either the <link> HTML tag or the Link HTTP response header. As for specifying the character set, we recommend you to use the HTTP header, since it will be taken into account by the browser before it starts interpreting the HTML code for the page.

In the HTML page body:

<link href="resource-url" rel="directive" as="ressource-type" crossorigin="value" />

Through an HTTP header:

Link: <ressource-url>; rel="prefetch"; as="ressource-type"; crossorigin="value"

Whichever syntax you choose, the parameters are always the same:

  • The URL of the resource, of course
  • The directive to use
  • The type to consider for the resource, which allows you to adapt the Content-Security-Policy to the nature of the resource (learn more)
  • The crossorigin attribute, which we’ll discuss later

These settings can be used to define 4 directives supported by most modern browsers:

  • dns-prefetch: indicates to the browser that it should perform the resolution of a given domain name (determining the IP to contact) before that domain is used to download resources
  • preconnect: indicates to the browser that it should connect a given origin, before that domain is used to download resources. Preconnecting involves, like - dns-prefetch, the DNS resolution, but also the TCP handshake and TLS negotiation (if the page is secure)
  • prefetch: indicates to the browser that it can download a given resource, even if it is not detected in the page. The resource is downloaded with a low priority
  • preload: tells the browser that it must download a given resource as soon as possible, with high priority.

Using dns-prefetch can be interesting in the context of critical third parties: by resolving the domain upstream, a few milliseconds can be saved cost-effectively.
However, in most cases, you may want to use preconnect' instead ofdns-prefetch’, so as to anticipate the whole connection.

If your site must be compatible with Internet Explorer, which does not support preconnect, you can use the rel="preconnect dns-prefetch" syntax .

Use preload for resources that you know will be useful very early in the page load but that would not naturally be prioritized by the browser. This makes preload useless for synchronous scripts present in your <head>, which are already considered by the analyzer to have a high priority. You can use it to increase the priority of execution of an asynchronous script declared in your <head>. preload is also used to load resources referenced by other resources (such as web fonts, images, or other stylesheets referenced using @import) to retrieve them while the parent resource is fetched and parsed.

prefetch is a directive that sets a very low priority, don’t use it for essential resources. Actually, it can be very relevant for improving navigation on subsequent pages. One of the great use case is to include some prefetch directives during the authentication of a user, to take advantage of the time it takes them to input their login and password to preload the static resources needed to render the page they will see once authenticated.

The crossorigin attribute

The crossorigin attribute – which is optional – is used when fetching resources from origins that are different from the main origin (CORS).
For many resources (such as CSS, or images), you don’t need to specify it, unless you want to request these resources by passing authentication headers, cookies, etc. (with the use-credentials value).

For other types of resources, defined in more recent specifications, crossorigin must be explicitly stated. This is the case, for example, for fonts (see the specification), even when they come from the main origin.

But be aware of the implications: for example, if you are using preconnect on a third party domain from which you are retrieving images and fonts, make two declarations in order to create two connections: one without crossorigin, for the images, and the other with it, for the fonts.

Consume in moderation

Reading this article, you might assume it’s relevant to declare many Resource Hints so that the browser loads the page as quickly as possible to. That is not the case.

Since it sets a low download priority, you can use prefetch without any real impact on the current page load. Be careful though: its use will increase data consumption on your site, which can present issues both for you (increased traffic on your server), and your users (unnecessary over-consumption of resources).

Use preload sparingly, as it overrides the priorities set by the browser’s analyzer, both in terms of download and execution. For example, imagine that you have an async script in your <head>. Thanks to the async attribute, its download priority is low. However, once fetched, like any non-deffered script, its parsing and execution interrupt the main thread (you need to use the defer attribute to change that). If you add a preload directive matching this resource URL, the browser will fetch it faster, so it will parse it faster, negating the effect of your async attribute by interupting the main thread very early in the page load).

Though preconnect cost is low, it is not null. If the open connection is not used quickly, then the preconnect directives only add extra CPU usage (both client and server) and unnecessary network competition.

[…] use it wisely: each open socket incurs costs both on the client and server, and you want to avoid opening sockets that might go unused. As always, apply, measure real-world impact, and iterate to get the best performance mileage from this feature. ”Eliminating Roundtrips with Preconnect [EN]”, Ilya Grigorik

This advice from 2015 is still relevant, particularly for connections to secure origins, for which the validation of certificates adds some CPU and network overhead.

The same kind of recommendations can be found in the work of Ivan Akulov, who even advises to switch to dns-prefetch, which is cheaper, if more than 4 to 6 domains are concerned.

As you can see, with great power comes great responsibility. If you want to get your hands on the priorities generated natively by the browser, then you must proceed in a moderate and responsible way, in order to avoid reproducing network congestion and CPU consumption that would affect your users. This can be very profitable, especially to optimize third party services (analytics, web fonts, etc.).
Like many web performance topics: test, measure and iterate!

Trackers on Your Domain, Revenue Risk

News that may not seem related sometimes, in fact, are. If the law does not prevail, money will.

1st Party Trackers

Collecting as much data as possible (and especially collecting it well) is one of the main issues for all brands. Nevertheless, faced with the growth of adblocking, the implementation of the General Data Protection Regulation (GDPR) and the ever-widening gap between the treatment of different types of cookies, some questions need to be asked.

How to succeed not to feel the impact of these elements on its collection and therefore on its data-driven strategy? How to preserve the quantity and the quality of its data? And if, because of these elements, your Tag Management System (TMS) does not trigger? Have you wondered about the 1st party?

Here is the introduction you can read on the page “How To Avoid Missing Out On Data Due to GDPR” on Eulerian’s blog, one of the leading solutions for attribution (meaning, tracking).

If you didn’t understand the rhetoric, it’s simply a question of how to get around the lack of consent of Internet users (or even the clear expression of their non-consent when they install adblockers) to collect data anyways. The proposed “solution”: hide the dirt under the carpet by hiding the script in a sub-domain of the brand.

For example, instead of sending data to my_domain.eulerian.net, the organization sends it to 43bdf.my_domain.com and then ensures that 43bdf.my_domain.com points to my_domain.eulerian.net.

The amount of ethical issues raised by this practice is significant, but it also raises security issues since, if not properly implemented, the manipulation can leak session data to a third party, leading to usurpation of the user session, critical data theft or defacing of the platform. A risk that tracking solutions providers don’t highlight so much.

A “Slow Page” Badge on Chrome?

Google has announced that they’re going to experiment a badge to penalize slow sites.

Experiments of this type had already been carried out in 2015. “Slow To Load” and “Red Slow Label” badges have been displayed on search results. This time, Google advertises starting experiments in Chrome.

Mobile screenshots

Example of an experiment that could be carried out: when loading a slow moving page, the loading bar would be blue and the loading screen would display a warning badge. When loading a potentially fast page, the bar would be green.

Since the end of the 2000s, Google has multiplied initiatives around Web Performance. Since 2017, however, I have felt an acceleration, probably due to their desire to index the Web more accurately using probes always equipped with the latest version of Chrome and running JavaScript. A tendency around which new indicators have even been created, such as the Time To (Consistently) Interactive which, while not being a good UX indicator, is an excellent end-of-load indicator for a bot.

If the law does not prevail, money will

If you work in an organization that is considering masking third parties in a 1st Party domain, please don’t, for ethical and security reasons.

If this is not enough for you, know that you will quickly lose experienced users who will develop and equip themselves with software that detect these scripts despite your manipulations, and will refuse to condone these schemes.

If you are still not convinced, I encourage you to carefully monitor your Web Performance. If these third parties respond slowly, then it would slow Google’s perception of your entire domain.

We already know that the degradation of Web Performance impacts ranking. With Chrome’s experiments, it could impact visits to your entire origin. We are no longer talking about people who will think that their connection may be temporarily poor, but about people who will be notified by Google that your site is slow, and will leave.

Do you really want to take that risk?

Performance timing: wait for the next frame
when using the User Timing API

The usual web performance metrics (First Byte, Speed Index…) are very interesting but I often need to add custom temporal markers, based on events that make sense from a business point of view, like:

  • the moment a specific content or feature is available to users
  • the beginning and end of the display of a loading animation (useful in complex funnels!)
  • in a page broken down into components retrieving their content from an API, the specific display times of each component
  • etc.

I use the User Timing API (see on MDN) to create named timestamps that belong to the browser’s performance timeline. As I can retrieve this timeline in Dareboost or Contentsquare Speed Analysis, I can track their evolution over time.

Two curves in a graph. On the x-axis, a date range of one month. On the Y-axis, the time between 0 and 3s. The orange curve shows timing "mark_declare_js_end" while the green curve corresponds to timing "mark_switchlang_end".

Some Custom Timings of this site

Using the API in JavaScript is quite simple (and broadly supported), for example:

// The thing you want to monitor the occurrence of
document.getElementById('content').classList.add('blue');
// The timestamp
performance.mark('mark-blue');

You can then retrieve the value in your browser developers tools, using:

performance.getEntriesByType('mark');

However, I recently1 realized that I often forgot something important: just because the browser execute some JavaScript code does not mean that the user can see the results of this execution. The browser must update the display, and its ability to do so depends on the JavaScript code that follows the piece of code we’re interested in.

In the following example, I inject a 1-second blocking loop after my performance mark, preventing the browser to update of the display.

// The thing you want to monitor the occurrence of
document.getElementById('content').classList.add('blue');
// The timestamp
performance.mark('mark-blue-sync');

// A snippet of code that consumes resources during 1 second
let n = performance.now();
while (performance.now() - n < 1000) {}

Of course, in real life, you won’t have a simple loop. You will have other tasks that may or may not take a long time. You can’t know it and, in fact, you can’t even test it, because it all depends on the customer context that you don’t control.

To get around this problem, we can use requestAnimationFrame() to ask for our mark to be put set before the browser performs the next repaint:

// The thing you want to monitor the occurrence of
document.getElementById('content').classList.add('blue');
performance.mark('mark-blue-sync');
// The timestamp, before the next repaint
window.requestAnimationFrame(() => {
    performance.mark('mark-blue-frame');
});

// A snippet of code that consumes resources during 1 second
// but we don't care anymore
let n = performance.now();
while (performance.now() - n < 1000) {}

If you want to see this for yourself, here’s a test page.

IN A NUTSHELL

Call the User Timings API to create custom business-related timestamps.

Encapsulate them inside requestAnimationFrame() callbacks to get to understand how the UI behaves, rather than the code execution.

If you want to have an idea of the display latency, attach two marks: one after the event to be followed, the other in a requestAnimationFrame() callback.

  1. Reading “Performance metrics for blazingly fast web apps”, by Conrad Irwin ↩

Measuring Interactivity with TTI
Time To (consistently) Interactive

When we talk about web performance measurement, what we’re actually trying to determine is the moment when a user can effectively achieve his or her goal. Meaning the users can consult the content they are looking for and/or interact with the page in a satisfactory way. Some metrics endorse rendering actions by the browser, others measure the progress of the display through the recording of a video. However, a great mystery remains: how to properly measure interactivity.

For a few years now, Google has been pushing an ambiguous metric: Time To Interactive. What does it mean? Let’s define it and explain how and when to use it (or not).

Note: this post first appeared in Dareboost’s Blog (discontinued).
 Photo of a carousel in action. The rotational movement creates a fuzzy effect: it is impossible to know with certainty the speed of the merry-go-round.

Measuring interactivity is like getting on a moving ride. When can we consider that the carousel is slow enough to consider that we can jump on it? There’s no precise answer.

TL;DR

The measurement of interactiveness is a pregnant challenge for Web Performance experts. Synthetic monitoring solution vendors, especially, find it difficult to provide a computable metric in the absence of user input.

Google’s Time To Interactive is a sophisticated measure designed to determine the ideal conditions for interactivity by monitoring both the JS main thread activity and the network. It’s quite effective at determining a time when you are sure that an interaction will be seamless.

However, TTI is also a complex metric to understand and to exploit that does not measure what most people think it measures, which is the time it takes for a page to become interactive.

Real User Monitoring (RUM) remains the only way to capture user’s actions and even there, we still don’t have a single KPI which simply depicts the relationship between users behavior and the interactivity of the page over time.


The quest for a new metric

What are we trying to measure?

Accessing a web page is an experience that the web performance world generally describes as 4 moments:

  1. The user has confirmation that loading has started.
  2. The user has enough information in front of them to think that they can interact with the page.
  3. The user can interact with the page (this particular moment being dependant of the type of the interaction).
  4. The user’s interaction with the page is effortless and intuitive, with no delays and jank.

Several signals give the user indications that the loading has started: the url and title change, the browser may animate the tab and / or the favicon, the first non-blank pixels appear, then the rest of the page…

Speed Index and First Contentful Paint give a good idea of the visual perception of visitors. They help to understand the perceived load of the page. They have limitations that can be identified at a glance by a human being through video or filmstrip because their algorithm is directly related to what is displayed.

However, when talking about measuring interactivity – points 3 and 4 – things get harder. Truth is, we don’t actually know how to measure it. The only thing we know how to do well is to collect information that allows us to deduce these particular moments.

For example, Akamai has been looking for new ways to measure user activity for years. They rely on the Boomerang library, created by Philip Tellis. Philip came to We Love Speed 2018 to expose the new user experience metrics that the Boomerang team has been collecting to measure page responsiveness: Rage Clicks, Missed Clicks, Dead Clicks, and Cursor Trashing. By analyzing the distribution of this data qualifying user frustration, we can infer approximately when the user expects the page, or a particular component, to be interactive.

 Rage Clicks by First Interaction and Visually Ready: there's a clear linear correlation; the slope varies between 1.2 and 1.5.

There’s a clear linear correlation between rage clicks and 1.2 to 1.5× the time to Visually Ready (when the page would look to the user like they could interact with it – see the full definition on Boomerang documentation).

This type of correlation requires large amounts of data collected from real users, either through JavaScript libraries like Boomerang, or in-browser RUM like the Chrome UX Report. This data can only be collected on production environments with large amounts of visitors.

Testing optimizations in this environment is risky. Without prior testing, deploying in production can introduce regressions/slowdowns and hurt your business. Moreover, you’ll have to wait to collect large enough volume of data, and it will be difficult to evaluate, because RUM data is not so easy to analyze.

Synthetic Monitoring solutions can perform accurate performance measurements on all environments, while controlling test contexts. They would be even more useful if they could provide an interactivity metric.

But since they do not involve real users, they are forced to engage in shenanigans…

Let’s introduce… Time To (Consistently) Interactive

NOTE
Although there are several definitions, we will focus on the definition put forward by Google through their tools and websites.

Interactivity can be considered in two ways: either as a switch between two states (non-interactive and interactive) or as a continuum. Knowing when a page becomes interactive for the first time is interesting but if the interface does not respond quickly, the UX will be very degraded. By “interactivity”, we refer here both to the fact that the page is interactive and to the fact that interactions can take place in a satisfactory way.

Time To Interactive, previously known as “Time To Consistently Interactive”, is an experimental synthetic metric that attempts to measure when your web application is both visually rendered and interactive.

 Superposition of several photos of a dancer in movement. Each movement is captured and yet it is impossible to grasp the continuum on a static image.

As moving things are difficult to grasp, we often rely on approximations and models.

TTI is an interactivity metric that does not rely on real users interactions. Instead, the algorithm makes an approximation by considering that a satisfactory interaction can only happen in specific conditions, and focuses on determining the prevalence of these conditions.

To determine the TTI, the algorithm advances along the timeline, performs checks, and redefines its candidate value for the TTI until it finds a moment where all conditions are met. First, it chooses, as the lower limit, when the user feels that the primary content of the page is visible. Several metrics are available for this: the “Time To Interactive Explainer” uses the First Meaningful Paint, but you can also use the First Contentful Paint, as WebPageTest does.

Then, the TTI’s algorithm verifies that the browser is able to handle the interaction. As many user inputs are handled by client-side JavaScript, working in a single thread environment, the algorithm must then ensure that no long-lasting JavaScript tasks are currently occupying that thread, preventing JS from handling the user inputs right away. For the W3C, a task is “long” if it lasts longer than 50 ms (Long Task). TTI will observe the JS tasks and wait for a 5-second period of time without Long Tasks.

However, all this is useless if the JS code necessary to handle the interaction is not yet downloaded. Rather than finely observing each HTTP response to see if JavaScript resources are downloaded, the Time To Interactive algorithm will use a signal: it will wait until it observes a period of at least 5 seconds during which it never sees more than 2 resources (all types combined) being downloaded in parallel.

If one of the conditions (Long Task and Network) is not met, the algorithm moves its candidate value for the TTI forward and resumes observation to find another Long Task and another 5-second network-quiet window after the last observed Long Task. At that point, the candidate value for the TTI corresponds to the end of the last observed Long Task.

But we’re not finished! At last, the algorithm does not consider a page to be interactive until the browser has finished parsing the document so if the DOMContentLoadedEnd event occurs after our candidate value for TTI, this moment is chosen as the final value for Time To Interactive.

 A graph summarizing the above explanations.

Schematic diagram of the definition, in the "Time To Interactive Explainer".

How to use the TTI?

When you start to look at the performance in terms of display, you quickly discover the Visually Complete, i.e. the moment when the entire rendering of the visible area of the page is finished.

Time To Interactive is pretty much like Visually Complete: a time marker for the end of something. The main question is “what?”. Tim Dresser found out the most adequate way to define this: TTI is a “no jank past this point” metric and that’s something you would want to monitor and optimize or, at least, not deteriorate without good reasons.

Indeed, the TTI is computed from the indirect observation of both the CPU – through the JS Long Tasks – and the network activity. If the TTI increases, it definitely means that a JS Long Task happened later than before, during the page load, and it is important to know why. Has a new Long Task been introduced? Is it a previously known tasks pushed back by a new piece of code? Is this a consequence of some newly-implemented third-party dependency?

As we’ll demonstrate later in the article, this Long Task is not necessarily harmful to your UX (for example, if you defer your scripts, then the Long Tasks they produced will occur later) but you can certainly optimize to make sure they don’t happen (for example, you can delegate complex JavaScript algorithms to Web Workers, making them run in background tasks, therefore not occupying the JavaScript main thread).

Common misconception about Time To Interactive

Time to Interactive is not the time until a page is interactive

“Time To Interactive” is a really ambiguous name.

Even in the Lighthouse documentation, you can read short misleading definitions like:

The Time to Interactive (TTI) metric measures how long it takes a page to become interactive.

Fortunately, the sentence is followed by a definition of what “interactive” means here, but for someone who wouldn’t read any further, the damage is done.

As a matter of fact, the Time To Interactive does not measure how long it takes for a page to become interactive, it measures how long it takes to be sure, regarding the conditions, that a interactivity can happen in a satisfactory way, for at least 5 seconds. That’s why the metric was previously known as Time To Consistently Interactive.

We can totally have a very fast and usable page that, however, has a massive TTI. To do this, all you need is for the page to perform Long Tasks of the shortest possible duration, at a rate sufficient to interrupt the TTI observation window. This page, for example, executes a 51ms task every 2 seconds, during a total of 20 seconds and its TTI is over 19 seconds.

Still, the page is perfectly interactive way sooner than the TTI suggests.

In the TTI algorithm, the “network quiet” subwindow is only a signal

TTI is always linked to the last JS long task. The “quiet network” heuristic is just a signal. I’ve seen people asking if they need to improve their waterfall to artificially create cascades containing less than two simultaneous requests. If none of these requests involve a Long Task, you can relax, your TTI will not suffer.

However, as this is a signal only, it does not guarantee that the JS code required to handle the interaction is available at all. You can have pretty good Time To Interactive and a page that is not interactive – as expected by user – at all.

Google’s TTI is not everyone’s

Every time Google introduces a new concept, there is a strong market demand. But be careful, Time To Interactive is not a standard!

Akamai’s Boomerang, one of the most famous Real User Monitoring solution, has its own definition of Time To Interactive, that differs a lot from Google’s. They use different signals like Frame Rate, Long Tasks, Page Busyness (via setInterval) and delayed user interactions. Even if they keep the W3C 50ms Long Tasks definition, their window of quiescence is only 500ms long (instead of 5 seconds), which mitigates TTIs from being extended due to isolated tasks.

During my research, I’ve also found that some Synthetic Monitoring solutions claim to support the Time To Interactive metric but, as with load time, you should always verify their definition, because some solutions do not hesitate to brand a “TTI” label on other metrics (such as the domInteractive event) that have nothing to do with Google’s TTI.

Time to Interactive is not easy to stabilize

A metric that is not predictable is difficult to understand. In researching this article, we have gathered this evidence that suggests that the TTI is one of those complex metrics, hard to stabilize.

I tried it out and it was a too unstable metric to measure Wikipedia. Here’s an example: https://phabricator.wikimedia.org/T176369

Peter Hedenskog, Software Engineer (Contractor), for the Wikimedia Foundation

There are few feedbacks on the TTI

There is little data on the correlation of TTI in the wild and none of them allow us to say that it’s more interesting than the existing metrics.

Based on a first study by Deepanjan Roy (a 28-website scoresheet), Time To Interactive has later been qualified by Tim Dresser, without much success. To be honest, these correlations are very difficult to obtain: as we can see from Tim’s analysis, the correlation of more stable metrics like FCP in the wild vs. in the lab is not good either.

I found one study from 2017, by Nic Jansma, quoted by Addy Osmani, where he explains that improving the TTI has a real impact on conversion rate in a real Use Case but the slides don’t give access to the data nor the experimental conditions.

Other Use Cases available online often consist in removing all JavaScript from the Landing Pages which is a pretty partial move, where other solutions (like downloading and byte-caching the JS in a Service Worker for future use) could have been chosen. Don’t get me wrong, I’m all for reducing the JavaScript to its smallest share, but never at the expense of the user journey.

Time To Interactive is entering a Web Performance landscape that already offers multiple metrics, some of which are easier to understand and comment. Most of the Use Cases I read about Time To Interactive do not clarify whether the existing metrics were sufficient to qualify the situation. Most site owners only monitor and report on 3 or 4 web performance metrics. Before we ask them to drop one of them for this one, I think it’s important that they can get an extensive idea of their respective relevance.

The Long Task “50ms” definition creates a threshold effect

The TTI thresholds have the merit of raising awareness of the importance of performance budgets. TTI is kind of a performance budget: “the main thread activity must stay under the 50ms budget”.

However, the definition of any threshold has impact.

 Capture from WebPageTest. The evaluation of the "Interactive Page" is green very early in the page, but disturbed by a red part much later in the loading.

Let’s take a really simple blog post page, and test it on Desktop with WebPageTest. The page is visually ready and completely interactive as soon as 1.2s. At that moment and during several seconds, a visitor can read and scroll freely. Around 3.5 seconds, a reCaptcha script execution creates a 150ms Long Task (in red, on the bottom bar) that push the Time To Interactive forward. Will this delay be perceived by the visitor? By the way, how long would a delay take to be felt by a visitor?

According to the RAIL performance model (Response, Animation, Idle, Load), the user perception of performance delays depends on the nature of the delay. Interaction delays are perceived after ~100ms. A value consistent with Nielsen’s 1993 post, based on Miller & Card et al. studies.

If the perceived delay is 100ms, why consider a JS task as long from 50ms? The explanation lies in the Long Task API specification:

The RAIL performance model suggests that applications should respond in under 100ms to user input (for touch move and scrolling, in under 16ms). Our goal with this API is to surface notifications about tasks that may prevent the application from hitting these targets. We surface tasks that take 50ms or more. A website without these tasks should respond to user input in under 100ms: it will take less than 50ms to finish the task that is being executed when the user input is received and less than 50ms to execute the task to react to such user input.

Long Task API 1

In other words: handling an interaction requires both that the browser is able to handle the user input by not being already busy (interactivity) and that is can handle fast enough the potential JS code execution triggered by the user action (responsiveness). As we don’t know the actual response time of the browser to handle the triggered processing, we consider this time should be less than 50ms. That leaves 50ms for the browser to be free enough to react to the input.

But in practice, all browsers and browsing contexts are different and there are many factors that can influence the time taken by the browser to process a task.

Interactivity measurement: is TTI enough?

TTI as a new reference metric?

Creating and promoting a metric is a performative act especially when the metric is defined as THE reference metric for interactivity: when pushed by Google, the metric not only evaluates the Web, it shapes it. SEO/SEM experts highly value it to their customers, companies use it in rankings. Quickly, everyone considers the metric as a reference, without questioning its rationale.

However, its many limitations, consistent with its definition based on many approximations, make the TTI a rather binary metric. Either the TTI is very low and you can be happy because you are absolutely certain that the web page offers the best conditions for quality interactions; or it’s not, and you need to investigate further to know what is happening. Some tasks can be delaying the TTI without bothering end-users but the page may also be unusable. You just don’t have any way to distinguish the two possibilities without further investigation.

 A microscope zooming on a sample.

A bad TTI is a sign that not all conditions are perfect for interactivity. This does not mean that interactions will necessarily be degraded. More investigation is always needed.

A milestone more than an evaluation of a continuum

Time To Interactive is to interactivity what the Visually Complete is to display: a final milestone. What we’re missing is “a Speed Index of interactions” where each Long Task would be weighted by its duration and the time at which it occurs, in relation to other metrics (e. g. rendering metrics) to infer the user’s frustration.

In the previously mentioned study, Nic Jansma observed the distribution of Long Task durations and found a correlation with conversion. I hope that we will make progress on this subject in the coming years.

 First Page LongTask Time vs. Conversion Rate (left); First Page LongTask Time vs. Session Length (right)

Nic’s study did not observe a decrease in conversion as long as the First Page Long Tasks were shorter than – not 50ms – but 100ms. Isn’t that interesting?

In the meantime, a lot of other metrics exist regarding interactivity, mainly in RUM, where real user activity can be monitored. For example, I think the distribution of First Input Delays is an extremely relevant self-explanatory information but this would be a story for another blog post.

Remember: if you need to understand what’s happening with your JavaScript code in Synthetic Monitoring, you can still use Custom Timings to deploy a full instrumentation. It’s the best way to grasp what matters to your business.


More about interactivity and the Time To Interactive:

A touch of archaeology


Thanks to Henri, Phillip, Peter, and Tim for having helped me to shape my ideas, and Damien for his multiple proofreading and advice.

Netflix: how to increase video speed

A few month ago, I published a blog post about increasing Netflix videos’ brightness and people seems to really dig it. But what if you really need to speed up your current episode to finish it before your bae arrives or slow down Beyoncé’s moves to better learn one of her routine in HOMECOMING? No problem.

Click and drag the following link in your favorites:

Manage Video Playback Rate

Then go to Netflix, HBO Now, Hulu, or pretty much any streaming service using HTML videos1, launch your favorite series or movie, and click it!

And if you want to manage both brightness and video playback rate without multiplying bookmarks, here’s one that do both:

Manage Video Brightness and Playback Rate

Feel free to rename the bookmark with shorter labels. For example, I use the ☀️ (sun) and 🏃‍ (running) emojis (and only that).

GIF: Beyoncé, dressed as a Queen she is on the Mrs. Carter Wordl Tour

Now you’re the Queen.

  1. As explained in the previous post, if the website has defined a Content-Security-Policy blocking bookmarks, this won’t work, sorry! ↩

Lazy Loading, faster webpages, SEO friendly

Images are a key content on your website? If you’re serious about your website performance, you have probably optimized them. But have you considered to lazy load your images? Lazy loading images improves the user experience by saving bandwidth for important content first.

Some reject the technique for SEO considerations. But properly lazy loading your images does not prevent them from being indexed. Let’s find out why you should implement lazy load, and how to make sure you build it in a SEO friendly way.

Note: this post first appeared in Dareboost’s Blog (discontinued).

Images are everywhere on the Web. Serving the right image in the right context can be really challenging. Images need to be optimized, adapted to its rendering area, and only loaded if required.

Images Lazy Loading is a set of techniques designed to answer this last requirement. An image will be loaded only if it is useful for the visitor: the download of an image is triggered when it’s needed: after a specific interaction, as a result of a scroll… or never.

According to HTTPArchive, 420 KB (median value) could be saved per page by lazy-loading offscreen and hidden images.

Graph showing the amount of data that could be saved by not loading off-screen images.

Some use cases

There are many concrete cases where Lazy Loading is involved. Let us take a few minutes to cite a few examples.

E-Commerce Search Results. These pages often contain so many results that a lot of products are outside the viewport. Is it useful to download their images? With Lazy Loading, you can delay their loading until the page is scrolled.

Carousels. You know about them, right? Why should the user load all of the images whereas it will only showcase the first one during several seconds… Lazy load them! Load the first one, and trigger the download of the next when in the background a couple of seconds before the carousel animation.

Menus and tabs. Images contained in a menu or a tab are often hidden, only displayed after a click. With Lazy Loading, you can delay the loading of the images until the button displaying the element is hovered or clicked.

Depending on the nature of your page, other cases are possible. No images should be included on your pages without previously asking yourself the question of delaying their download. Because at the end of the day, there are significant performance gains.

The bare necessities

By postponing the loading of images that are not immediately required – or, in some cases, not loading them at all – the browser saves resources (bandwidth as well as CPU). The page loads faster and the user experience is improved as saved resources can be affected to more critical content. There are also server-side gains. The CPU and bandwidth required to delivered the resources are subjected to less stress, reducing the hosting and/or CDN costs.

As said in the introduction, Lazy Loading do not prevent your images from being indexed by search engines. But it can be tricky and all the techniques are not equals, as all the best practices are not implemented by the various libraries and plugins available on the market. To preserve your organic SEO, you need to understand how Lazy Loading works, and how to use it safely.

LazyLoad with JavaScript

In a perfect world, the browser would automatically lazy load the images. This may be the case in the future, as a Lazyload Feature Policy is under study, but we’re not there yet. In the meantime, we have to explore other solutions, every one of them implying a modification of the HTML markup and the addition of a JavaScript (JS) dependency.

IMPORTANT
You don’t need to – and shouldn’t – lazy load all your images. If you know that some images will be displayed most of the time , let them be loaded and rendered normally. Lazy Loading is only recommended for the other images. Do not add complexity when it’s not required!

The most traditional solution consists of using JS to reassess, at regular intervals and for each image (or each element displaying an image as a background), if it needs to be loaded. High-performance libraries such as lazysizes are built on this paradigm and are compatible with older browsers. lazysizes can even detect if the User-Agent is able to scroll and, if not, load the images right away.

However, running those tests so regularly has a cost. This cost can be avoided for web browsers supporting the Intersection and Mutation Observer APIs (that provide the ability to react to specific DOM situations rather than having to test continuously). yall.js and lozad.js are good examples of this condition-based technique (they are only compatible with modern browsers, but you can use a polyfill to emulate the missing feature for older browsers).

TIP
As the browser may interpret any omission of src as an error, I strongly recommend that you still define the src attribute value, using a really small transparent image placeholder, even inline, like:

<img
src="data:image/gif;base64,R0lGODlhAQABAAAAACH5BAEKAAEALAAAAAABAAEAAAICTAEAOw=="
…

Whichever JavaScript solution you choose on the client side, you must modify your backend to return the right HTML code. The HTML markup for the lazy-loading of an image is always similar: the final value of the src attribute is temporarily placed in a data-src attribute which prevents the <img> element from loading the final image right away.

<!-- Lazy loaded image: before -->
<img data-src="garden.jpg" src="placeholder.jpg" class="js-lazyload" src="data…" />

<!-- Lazy loaded background image: before -->
<div data-class="bg-image-garden" class="container js-lazyload">…</div>

The library identifies its target images through an attribute, quite often using a specific class (for example, here, we are using the js-lazyload class). When the library detects it’s time to load the image, the data-src attribute is used to populate the src attribute and the browser starts loading the image. The technique is the same for other media types (video, iframes) or images adapted for responsive web design (for example, the data-srcset attribute can be used to temporarily retain the final value of the srcset attribute).

<!-- Lazy loaded image: after -->
<img src="garden.jpg" class="js-lazyload" … />

<!-- Lazy loaded background image: after -->
<div class="container js-lazyload bg-image-garden">…</div>

No JavaScript? Fallback with style (and <noscript>).

Search engine bots, such as Googlebots, are crawlers that browse the web for the purpose of content indexing. No one knows for sure when the Googlebots will execute JavaScript on their pages, and at what capacity. As demonstrated by Stephan Boyer in 2016 and later confirmed by Tom Greenaway at Google IO 2018, Googlebots do not execute JavaScript during their first visit. The final render can actually arrive several days later.

Because Googlebots actually runs two waves of indexing across web content, it’s possible some details might be missed. Tom Greeaway

Like some images.

Because if JavaScript properly executed, lazy loaded images will not be handled by it and the src attribute is never populated, preventing the browser from starting the download and displaying the images.

How to serve these images despite the absence of JavaScript? There’s a specific HTML element you can use: <noscript>. The content of an <noscript> element is displayed only if scripting features are not supported or are disabled. That’s exactly what we need!

So if your HTML response contains:

<img
    data-src="garden.jpg"
    src="data/…"
    alt="A spacious garden dominated by a large pine tree."
    class="lazyload"
/>
<noscript>
    <img src="garden.jpg" alt="A spacious garden dominated by a large pine tree." … />
</noscript>

then:

  • when JavaScript is available, only the first <img> element will be displayed;
  • when JavaScript is not available, both <img> elements are considered during the page display. The second one (in the <noscript> element), is displayed and indexable by search engines. The technique, confirmed by John Mueller, Webmaster Trends Analyst at Google, is exactly the same for background images:
<div data-class="bg-image-garden" class="container js-lazyload">…</div>
<noscript>
    <div class="container bg-image-garden">
        … A spacious garden dominated by a large pine tree. …
    </div>
</noscript>

Beware: don’t miss adding a specific style that will be applied when JavaScript is not available, hiding the non-lazy-loaded images.

You may be afraid of the resulting verbose HTML related to code duplication. Don’t worry, your HTML documents have to be compressed with gzip or brotli before being sent on the network, hence a marginal impact in transfer size (if you’re not sure your website is properly using compression, audit your pages on Dareboost).

Of course, it remains true that entering all these tags is tedious. When managing responsive images, artistic direction… the markup of images can be very, very complex. So anyway, you should not enter this HTML code manually: dealing automatically with this kind of complexity should be the work of your CMS or a task of your contribution workflow whatever it is.

About fifty lines of very dense HTML.

Mark-up an image from The Guardian, even before the implementation of a Lazy Loading

Testing the implementation

Once you’ve implemented Lazy Loading, you’ll need to test that it works. The simplest solution is, of course to run a full web performance diagnosis with Dareboost to detect if all the images outside of the viewport are lazyloaded. If it’s not the case, we’ll tell you and give you the URLs of the images for which loading can be postponed.

If you have conditioned the loading of your images to a browser or a custom event, feel free to use your report’s Waterfall to check that the loading of images follows the correct sequence. In the case of a custom event, feel free to also use a Custom Timing: you’ll be able to find the event in the Waterfall.

It may also need to do manual tests. Open your browser on the concerned webpage, open the Developper Tools and select the Network tab (every modern browser features it). Empty the network stack to better visualize new calls, then provoke the interaction meant to start the lazy loading.

Here is an example on Chrome, with the Lazy Loading activated during scrolling:

You may consider automating these tests by using browser-based tools to perform tests. Puppeteer is one of them and can be used to test the behavior of your lazy loading on Chrome or Chromium, to make sure that your real users will see your images.

To verify that crawler bots will also see your images, you can ask Google itself, using the URL Inspector tool of the Google Search Console. You will view your page exactly as fetch by Google. Just insert your URL for Googlebot to test your page and screenshot the result to confirm that your <noscript> fallback is working.


Here we are, you now know everything there is to know about Images Lazy Load, its SEO impact and the best way to get around it. Let’s trim some pages!

Optimizing Jekyll build time

Being more and more tired of WordPress and its galaxy of dubious-quality plugins, I decided to migrate to a static site generator three years ago. After a few tries with other solutions, I decided to migrate to Jekyll, whose community seemed more mature to me.

After three years working on Jekyll, I’m starting to understand the strengths and weaknesses of the solution, but I am far from mastering its mysteries. I tweaked it to publish multilingual content, developed my own plugins, integrated pieces of architecture I discovered in some of my friends’ repos… Let’s say I’m quite used to it now.

But nowadays, my Jekyll build looked less like the famous doctor than the Frankenstein monster: a patchwork of code roughly tied together by delicate strings, slowly moving as it moans.


TL;DR

  • Noting that my Jekyll compilation was very slow, I asked the French JAMstack community for advice.
  • Several things have emerged, each tip allowing me to optimize the compilation time.
  • The biggest gain comes from Jekyll’s own evolutions, because the Core Team is doing a huge amount of work.

To generate my site, I developed a set of rake commands to clean the workspace, determine the destination environment and configure the build accordingly, check the integrity of the front-matter headers of my posts, generate the site with Jekyll and, finally, control what’s produced using the html-proofer gem. I don’t run all this on my computer: instead, I delegate this task to Netlify, connected to my GitHub repository to compile and deploy my branches.

All these tasks obviously take time, but the part dedicated to the generation with Jekyll remained the most CPU-consuming. For months, my Netlify builds had been over 10 minutes. Every build was slower than the previous one.

A few days ago, Netlify stopped deploying the website altogether. The build took too long and exceeded the limit imposed by Netlify’s continuous deployment system1.

It was time to act.


An African proverb says:

If you want to go fast, go alone. If you want to go far, go together.

I don’t think that’s entirely true. I believe that when we surround ourselves with the right people, we can go elsewhere, towards possibilities we had not even considered.


So when I thought I was reaching the limit of my skills, I asked for help from the community I know best: the JAMstatic Slack members. And among them, a member of the Jekyll’s core team, Frank. He helped me a lot (and still does) by pointing out possibilities that I hadn’t contemplated.

Includes: to be consumed in moderation

Experience has taught me that it is often more difficult to maintain a project than to carry it out in the first place. To increase your chances of success, it is better to find techniques for organizing the code that are adapted to your long-term understanding. In my opinion, dividing the code into significant portions is one of the most effective maintenance tips.

In Jekyll, this is achieved via the {% include %} tag. However, be careful, an overly ambitious code break-down will have a cost on your compilation time, which you can view with the Liquid profiler.

According to Pat Hawks, a member of the Jekyll Core Team:

Every time you use an {% include %} tag, Jekyll has to open the included file, read its contents into memory, and then parse the template with Liquid. This happens once per {% include %} tag not per file! This means that using the same include on 100 pages will cause that include to be loaded/parsed 100 times. The problem gets worse very quickly if you start including includes in your includes…

One way to overcome this additional cost is to cache the blocks compiled during the interpretation of your {% include %} and there’s a plugin for that: Ben Balter’s jekyll-include-cache. But beware of two very important things:

  1. Be sure to pass all the data necessary for your {% include %} as parameters, because they will be used as keys for the cache.
  2. use includes only to generate reusable portions or code. If the parameters of the include make it so specific that it’s not reusable, the {% include %} cache will have been built for nothing.

These two constraints are strong enough to force me to reintegrate more than half of my includes into layouts. I am not entirely satisfied with this situation (because, as a result, maintenance capacities are degraded) but I must admit that I saved nearly 10% of compilation time2 by sacrificing this little comfort.

And with liquid comments ({% comment %}This is a comment{% endcomment %}), I can still efficiently organize my code, even if it’s in a single file.

Trust the gems compiled in C

Out of the box, Jekyll is based on a set of gems written in Ruby. Recently, new gems have appeared, partially written in C, thus, more efficient. The Jekyll team was kind enough to add conditional tests in the generator to use these gems if they are referenced in your Gemfile.

So far, I’ve heard about two of them:

There are undoubtedly others, but I heard about at least two of them:

I don’t need Jekyll for my SASS files but by using liquid-c, I saved 9% of compilation time.

If you can avoid it, don’t use LSI

Jekyll comes with a very handy option called Latent Semantic Indexing (LSI) which role is to parse all the content before generating the site, in order to feed, for each post, a qualitative collection of related posts (instead of the ten most recent posts). LSI does a very good job but if you have hundreds of posts like I do, it will run slowly, very slowly.3

After a very quick non-analysis of the analytics I don’t have4, I decided to part with the related articles and save 17% of compilation time.

Markdown, choose the right flavor

Markdown is a really nice light markup language but it’s missing one thing very badly: standardization. There are dozens of Markdown parsers, each with their own specific features. For some time now, a standardization initiative has been emerging around CommonMark, and projects implementing it are flourishing.

By default, Jekyll uses kramdown, a Markdown superset developed in Ruby that does a very good job. To replace it with CommonMark, I used commonmarker which is, again, a Ruby wrapper for a C implementation. To take advantage of it in Jekyll, you can use Pat Hawks’ jekyll-commonmark plugin.

Be careful, the transition may require adaptations. kramdown and CommonMark are quite different: while switching from one to the other, I had to sacrifice some syntaxic sugars.

For example, CommonMark does not support block attributes such as { :.myclass} to decorate a content paragraph. You will need to use good old HTML tags. Don’t forget to enable the UNSAFE option in your Jekyll configuration (_config.yml) if you don’t want to generate a lot of <!-- raw HTML omitted --> comments:

markdown: CommonMark
commonmark:
  options: ["SMART", "FOOTNOTES", "UNSAFE", "HARDBREAKS"]
  extensions: ["strikethrough", "autolink", "table"]

You may also notice that CommonMark is less tolerant than kramdown. Switching to this parser helped me to detect problems in my post that I had never noticed before because kramdown was fixing them for me. If you have a significant amount of content, be prepared to fix a few typos.

A small price to pay to save another 9% of compilation time.

Trust the team for going in the right direction

Finally, one of the last improvements made was to switch to the main version of Jekyll. Since 3.8.5 (my previous version), many improvements have been made, and the performance gain is really considerable: 93%.

I versioned my _site folder and checked that nothing was breaking when switching versions because I couldn’t believe in such a gain and yet, it’s real.

If you were to retain – or test – only one optimization, it is this one: trust the Core Team, performance is on the way.

What about my multilingual mess?

After all these optimizations, my Jekyll compilation went from more than 15 minutes to about a minute. That’s still a lot, and I know why: my “homemade” management of internationalization, and more particularly of the translation of my articles, is suboptimal.

It is based on an i18n-key value that I place in the front-matter of my content files to match them across languages, as well as on a home-made plugin that, for each content, scans all the other contents to find which ones are translations of the current content. This O(n²) strategy, while easy to implement, is not effective at all and penalizes my build performance.

Ashwin Maroli, one of the Jekyll Plugin Core Team member, is working on a filepath-convention-based plugin that should considerably improve i18n: jekyll-locale. I tried to implement the plugin on my blog but encountered some drawbacks. I will come back to this later, especially when some plugins have been modified to be compatible, such as Sverrir Sigmundarson’s jekyll-paginate-v2.

I’ll be sure to mention it when everything will work out as it should!


Experimental protocol

Since the above optimizations also require to modify the content, I did not carry out a benchmark during the optimizations. I waited until I was completely finished and then, I went back and evaluated the gains step by step.

Here’s my test protocol: I started from an installation without any of these optimizations, then I wrote a script implementing the optimizations one by one (except the removal of the includes, because… I was too lazy to script the modification of my layouts) and, each time, compiled the website. I scheduled the script to be executed 10 times and went to bed while my computer spent nearly 16 hours benchmarking all this.

Here is the raw data:

Run Step Done in… (s)
Test 1 1 - Before 1337,872
Test 1 2 - Switch to liquid-c 1509,997
Test 1 3 - Remove LSI 1264,981
Test 1 4 - Switch to CommonMark 1282,607
Test 1 5 - Switch to main 64,949
Test 2 1 - Before 1510,356
Test 2 2 - Switch to liquid-c 1457,161
Test 2 3 - Remove LSI 1239,278
Test 2 4 - Switch to CommonMark 1058,934
Test 2 5 - Switch to main 72,335
Test 3 1 - Before 2148,253
Test 3 2 - Switch to liquid-c 1465,446
Test 3 3 - Remove LSI 1253,785
Test 3 4 - Switch to CommonMark 886,152
Test 3 5 - Switch to main 92,384
Test 4 1 - Before 1621,322
Test 4 2 - Switch to liquid-c 1506,737
Test 4 3 - Remove LSI 1225,414
Test 4 4 - Switch to CommonMark 1057,497
Test 4 5 - Switch to main 87,943
Test 5 1 - Before 1589,323
Test 5 2 - Switch to liquid-c 1607,33
Test 5 3 - Remove LSI 1261,815
Test 5 4 - Switch to CommonMark 914,124
Test 5 5 - Switch to main 77,526
Test 6 1 - Before 1643,596
Test 6 2 - Switch to liquid-c 1481,98
Test 6 3 - Remove LSI 1237,843
Test 6 4 - Switch to CommonMark 1336,47
Test 6 5 - Switch to main 69,099
Test 7 1 - Before 1456,432
Test 7 2 - Switch to liquid-c 1487,558
Test 7 3 - Remove LSI 1268,737
Test 7 4 - Switch to CommonMark 1106,233
Test 7 5 - Switch to main 69,562
Test 8 1 - Before 2943,453
Test 8 2 - Switch to liquid-c 1492,383
Test 8 3 - Remove LSI 1229,34
Test 8 4 - Switch to CommonMark 1321,156
Test 8 5 - Switch to main 70,332
Test 9 1 - Before 1587,532
Test 9 2 - Switch to liquid-c 1586,698
Test 9 3 - Remove LSI 1264,424
Test 9 4 - Switch to CommonMark 950,634
Test 9 5 - Switch to main 69,907
Test 10 1 - Before 1643,22
Test 10 2 - Switch to liquid-c 1581,063
Test 10 3 - Remove LSI 1229,119
Test 10 4 - Switch to CommonMark 1332,547
Test 10 5 - Switch to main 69,022
  1. 15 minutes, as confirmed by Chris McCraw in “How Our Build Bots Build Sites”. ↩

  2. You’re going to have to take my word for it, because my experimental protocol didn’t contain a test with and without inclusions. It is therefore a personal estimate. ↩

  3. It seems that the gem gsl is improving this, but I haven’t tested it. I am interested in your feedback. ↩

  4. Because I don’t need them to learn about my readers, as they often interact with me on Twitter or through comments ↩

Content Encoding: why and how to use the meta charset tag and the Content-Type header

Improving the speed at which a web page is displayed often means making the browser’s life as easy as possible. When the browser receives an HTTP response, it actually receives text encoded in bytes, where each byte or sequence of bytes represents a given character. If the browser does not have a clear information about the used encoding, it will waste time trying to guess and may fail in some cases.

Note: this post first appeared in Dareboost’s Blog (discontinued).

Although the Web is intended to be universal, the various human groups that use it have their own specificities. One of these specificities is language, especially when written. All textual content is composed of characters from a directory intended for a type of use. Hiraganas, for example, are phonetic system intended for the unambiguous transcription of the Japanese language.

Hiraganas

Table showing the writing direction of hiraganas
by Karine WIDMER (CC-BY-SA-3.0 · Source)

To be able to designate each character unambiguously, we must assign a unique identifier to each of them. The whole set of identifiers will be called a character set. Once this correspondence table has been defined, each character need be converted into a sequence of bytes so that we can store or share them between computers. This is called character encoding.

Imagine that I use a character set to write text and a corresponding encoding to convert it to bytes, which I later send to you. How would you decode it, and read the content, without knowing which encoding, or set, I used? Eventually, you would have to use some of the most common character set & encodings you know, expecting the result to make sense… What could go wrong?

Replace a semicolon (;) with a greek question mark (;) in your friend’s JavaScript and watch them pull their hair out over the syntax error.
Ben Johnson (@benbjohnson), November 16, 2014

So yeah… not a great idea.

For example, the bit sequence 1100 0011 1010 1001 represents the character “é” in the UTF-8 encoding. If you decode this sequence assuming you have to use the Latin-1 encoding and not UTF-8, you will read “Ã ©”.
In Latin-1, the character “é” is represented by the sequence 1110 1001.

When the browser receives bytes from your server, it needs to identify the collection of letters and symbols that were used in writing the text that was converted into these bytes, and the encoding used for this conversion, in order to reverse it. If no information of this kind has been transmitted, the browser will try to find recognizable patterns within the bytes to determine the encoding itself, and eventually try some common charsets, which will take time, delaying further processing of the page.

To speed up the display of your pages, you must specify the content encoding into your HTTP response.

How to choose the right character set?

There was a time when hundreds of character encodings coexisted, all limited and not able to contain enough characters to cover all the languages of the world. Sometimes, no encoding was adequate for all letters in a single language.

Nowadays, Unicode – a universal character set, defining all the characters necessary to write the majority of languages – has become a standard, no matter what platform, device, application or language you’re targeting. UTF-8 is one of the Unicode encodings and the one that should be used for Web content, according to the W3C:

Everyone developing content, whether content authors or programmers, should use the UTF-8 character encoding, unless there are very special reasons for using something else. (If you decide to not use UTF-8, you must choose one of the few encodings that are interoperably implemented across all browsers.)
”Introducing Character Sets and Encodings”, W3C

Note: if you’re using a database to store your content on the server side, you may be tempted to also use the “utf-8” charset too. Beware: on MySQL and MariaDB, it’s an alias for “utf8mb3”, a UTF-8 encoding called “Basic Multilingual Plane” – or BMP – that only stores a maximum of three bytes per code point. Instead, you’d rather use “utf8mb4”, an encoding that stores a maximum of four bytes per code point. Otherwise, you won’t be able to use some popular characters, such as 🚀, otherwise known as “U+1F680 ROCKET”!

How to advertise your character encoding… and the best way to do it.

Before going any further, let’s take a look at the vocabulary in use.

Historically, the terms “character encoding”, “character map”, “character set” and “code page” were synonymous in computer science[…]. But now the terms have related but distinct meanings,[…] Regardless, the terms are still used interchangeably, with character set being nearly ubiquitous.
”Character encoding”, Wikipedia

We find this use of “character set” or “charset” to designate, in reality, an encoding, in the HTML specifications. We will do the same in the rest of this article.

One of the easiest ways to specify a charset in an HTML page is to put in a <meta> tag in the element:

<meta charset="utf-8">

Declaring a character set this way requires certain constraints to be respected, one of them being that the element containing the character encoding declaration must be serialized completely within the first 1024 bytes of the document, to ensure that the browser will receive the information with the first IP packets transiting through the network and can use it to decode the rest of the document. As the charset <meta> tag is the only one with this kind of requirement, the most common tip is to place it directly after the element opening tag:

<html …>
  <head …>
    <meta charset="utf-8">

If you’re afraid to forget this, don’t worry. This is obviously one of the checks that Dareboost will perform for you within our website quality analysis tool. However, you may find yourself in a situation where this declaration is not sufficient, and the browser does not take it into account. Why? Because the Content-Type metadata of the page may indicate another character set and in the event of a conflict, this information – defined in the page HTTP headers – has priority.

To make sure of the information transmitted through the page metadata, you can use our Timeline / Waterfall feature. Unfold the detailed values of your main document to view the response HTTP headers, including the Content-Type header, containing the encoding metadata.

Content Type Header in an HTTP response

To change this HTTP header, you may need the help of the person who managed the server, whereas it’s your hosting service provider or a person in charge in your organization, because the configuration of the HTTP headers is very specific to the web server in use, and you’ll need the appropriate administrative rights to be able to modify those server settings.

On Apache 2.2+, the configuration of UTF-8 as a default character set for your text/plain and text/html files involves the AddDefaultCharset directive:

AddDefaultCharset utf-8

For other types of files, you’ll need the AddCharset directive;

AddCharset utf-8 .js .css …

On nginx, you’ll need to make sure that the ngx_http_charset_module is loaded, then use the charset directive.

charset utf-8;

Here too, it is possible to refine the scope so that other types of files than text/html are delivered in utf-8, using the directive charset_types:

charset_types text/html text/css application/javascript

Of course, you can also configure the Content-Type HTTP header from your server-side scripting code. For example, in PHP, you can use the header() network function. Don’t forget to define the Media Type (or MIME type) of the body of the response, in addition to the character set.

header('Content-type: text/html; charset=utf-8');

Beware: if your pages are delivered by a Content Delivery Network (CDN), you may have to configure the Content-Type header in the CDN configuration, as most of them don’t pass on the headers they find on your servers.

Additional Resources

One hosts file to block them all

As a field expert, people often ask me how to improve websites’ performance. Sometimes, they also ask me how to improve the Web’s performance on their own machine, for their own browsing experience. In that case, my answer is always the same: the lowest hanging fruit is most certainly the hosts file.

Gollum, holding the One ring in the Peter Jackson's adaptation

I lacked inspiration to find a nicer illustration….

Keeping the dirt away

Today’s web is full of dirt. Most sites are full of trackers, ads, and lots of other nasty stuff penalizing websites’ loading. To avoid this, AdBlockers are blooming. They offer a quick and simple solution (most of the time, a browser extension) that blocks most of the unwanted content.

Unfortunately, as for the UX, AdBlockers don’t deliver. They often increase the amount of memory and CPU cycles used by your web browser, slowing your browsing experience instead of boosting it. Some are doing better than others, and whole browsers1 have been conceived over the idea of blocking unwanted content, and are doing an incredible job. But the web is not confined to your browser, is it?

The Web is requested from everywhere in your computer. Most mainstream applications are as crammed with trackers as your next media website. Sometimes, you can even see the ads displayed in your UI (Hello, Skype. Yes, I’m talking about you, you naughty boy).

The AdBlockers can’t do anything about that. But a simple hosts file does.

Hosts… what?

The computer file hosts is an operating system file that maps hostnames to IP addresses. It is a plain text file. ”hosts (file)”, on Wikipedia

Whenever your browser interacts with a website, it actually requests a server, located through its IP address, like 185.31.40.11 (IPv4) or 2a00:b6e0:1:20:2::1 (IPv6). It’s pretty similar to a postal address.

Now think about accessing a webpage, like https://boris.schapira.dev. How does your browser know which IP address to contact? Well, the browser simply asks the Internet phone book. At least, one of them. And the phone book, called a DNS, resolves the IP address for the browser.

I don’t know about you, but I never use a phone book. Most of the time, I’ve collected the address of the people to whom I want to write in my personal address book. That’s the hosts file for you. Every time a process on your computer needs to access a resource on the Internet, it first goes through the hosts file to find out where to find it.

Now, let’s say that you don’t want this process to find the resource on the badthings.com domain. Easy peasy, throw it on the wrong track by associating the badthings.com domain to an unspecified address like 0.0.0.0.

So basically, if someone makes a list of all the domains where bad things happen, we can redirect them all to 0.0.0.0 in our hosts file, and make our own Web a much cooler place.

One project to gather them all

There is nothing new in what I am describing here. Cool people have been doing this for years, sharing their host files. Fake news websites, gaming platforms, pornographic hubs, encryption pages, fraud attempts, and scams are all patiently identified and listed in open access files.

I use Steven Black’s “hosts” project, a python script, to cram them into a single 2MB hosts file containing more than 70k domains. In case you’re wondering, I can and do alter the result with my own accept list (otherwise blocked domains whose requests I don’t want to prevent) and redirections (which allows me to write this article and check the result on https://borisschapira-dev.com:10443/, which actually points to my own machine).

If you’re not familiar with the command line and use Windows 10, the hostsman app will help you achieve the same goal (unfortunately, as I just published the post, the website looks down. Fortunately, a portable version exists).
I will not recommend modifying your host file on previous versions of Windows even if I did it, before 2015 (FR), unless you like to run ipconfig /flushdns every 30 minutes. On Linux, I’ve heard people talk about using dnscrypt-proxy… but I’ve never tried myself.

A screencapture from hostsman sources manager

You can manage Update Sources in hostsman

Some tips from my daily life

Sometimes, I need to temporaly disable this hosts file. For example, when I need to help Dareboost clients understand the impact of third-party scripts on their pages (thus, I need to load these 3ps myself).

To enable or disable my hosts file, I use a command line function that I’ve develop and put in my ~/.profile file[^ozsh]: [^ozsh]: Actually, I put this function in my ~/.zprofile, as I use Oh My ZSH.

function togglehost() {
    if [ -e /etc/host.bak ]
    then
        sudo mv /etc/host.bak /etc/hosts
        echo "Hosts file is active again"
    else
        sudo mv /etc/hosts /etc/host.bak
        echo "Hosts file is set aside"
    fi
}

Once this function is loaded, activating or deactivating my hosts file is very simple:

$ togglehost
Hosts file is set aside
$ togglehost
Hosts file is active again

But as I sometimes forget to put it back in place, I have set up a routine that checks every minute that the file is in place and, if it is not the case, warns me by using Jaime Piña’s noti to trigger a notification. To perform this regular check, I use crontab.

* * * * * if [ ! -e /etc/hosts ]; then /usr/local/bin/noti -t "Host file" -m "does not exists"; fi

I have been using this technique for years now and, sometimes, I forget that my hosts file protects me so much. Whenever I need to use someone else’s computer, or temporarily disable my hosts file, I realize the level of comfort it provides me.

I’m well aware that tweaking its own hosts file is a good but technical solution. It doesn’t completely replace an AdBlocker (or I haven’t aggregated enough files yet) but it’s an incredible performance gain, which I highly recommend for everyday browsing.

Try it for yourself, and tell me what you think!


Summary

Hosts files are your computer internal address books that guide Web requests to the right servers. Fill your hosts file with domains pointing to nothingness, and those requests will quickly and surely fail. People are sharing their hosts file for years. Solutions now exist to concatenate them, and crowdsource a solution to the dirty Web we’ve to deal with everyday.


Bonus

Some great alternatives to localhost:

# http://👻 (localghost)
127.0.0.1 xn--9q8h
# http://🏖️ (localcoast)
127.0.0.1 xn--km8h
# http://🚽 (when the project isn't very... motivating.)
127.0.0.1 xn--s78h

And many others on Emojipedia

  1. If you’ve never tested Brave Browser, I can only encourage you to do so, and join the 4 million people that trust it to fix the web. ↩

Netflix: how to increase video brightness

My kids are on vacation with their grandmothers, which leaves me a lot of free time to binge-watch TV shows on Netflix. Except I often get the impression that the Netflix videos are too dark, or at least darker than they ought to be, aren’t they?

So, between a PS4 game1 and a novel chapter2 (because there’s a life outside Netflix), I made a little bookmarklet that brightens the videos of the current page. To use it:

Click and drag the following link in your bookmarks bar3:

Manage Video Brightness

Then go to Netflix, launch your favorite series or movie and click on it!

GIF: The Joker is clapping.

Please note that this bookmarklet should work widely, not just on Netflix. One click on the bookmarklet and your browser will increase the brightness of all the videos on the current page, provided that the page itself does not prevent style injection with a Content-Security-Policy.

I tested on Firefox and Chrome, latest versions, on Mac. I will not go any further, nor will I provide support. Consider this snippet of code as being under WTFPL license.

In a hurry? There is also a bookmark to speed up your Netflix video?

  1. I am playing “Arkham Knight” by Rocksteady, and it’s a blast. I have a great time and I think a lot about my former colleague Stéphane, brilliant inventor of the famous “Batou” that the Joker uses to address Batman – the French equivalent to “Bats” –, which gives the game a special flavor. ↩

  2. I’m reading “The Golden Fool” by Robin Hobb, second volume of the “Tawny Man Trilogy”, which itself is part of the “The Realm of the Elderlings” series from which I have already read the seven previous books. And I plan to also read the next eight right within a year. ↩

  3. Feel free to rename the bookmark with a shorter label. For example, I use the ☀️ (sun) emoji (and only that). ↩

[Dogfooding] How Dareboost has benefited from Custom Timings monitoring

We may be Web Performance experts, we still don’t have superpowers. We also need tools to analyze our sites and applications. So when we released our new Custom Timings feature, we naturally jumped at the chance to test it on Dareboost.com… and immediately saw the benefit.

The Dareboost web application

Note: this post first appeared in Dareboost’s Blog (discontinued).

A few weeks ago, we have introduced a new feature in your page analysis reports and monitors: Custom Timings, tailor-made markers, to be placed in JavaScript using the User Timing API, that you can then display in Dareboost to visualize their evolution over time.

We’ve chosen to prioritize this feature within our backlog because we were deeply convinced that it would allow our customers to better understand their websites performance. In fact, using it is so simple that we immediately found a practical application to meet our own needs!

To explain this, let’s take a look under Dareboost’s hood first.

Dareboost: an AngularJS application personalized according to the current user’s rights

Any visitor consulting Dareboost website uses a real Web Application. In other words, the user’s browser loads JavaScript code that, once executed, takes over the browsing experience and emulates the behaviour of an application instead of the navigation between multiple web pages. For example, a user can switch from one screen to another without reloading the side menu.

To ensure this applicative behaviour in a web page, known as SPA (for Single Page Application), we use a JavaScript framework: AngularJS. This framework performs the customization operations, using an XHR request (XMLHttpRequest) to retrieve the user’s context.

Two shakes of a lamb’s tail

We decided to set up several Custom Timings:

  • When AngularJS begins its bootstrapping: angular_boostrap_start
  • When AngularJS is bootstrapped (and starts doing what we want him to do to present Dareboost’s interface): angular_boostrap_end
  • When we ask Angular to fetch the current user’s context: userinfo_xhr_start
  • When the context is effectively recovered: userinfo_xhr_stop
  • When the content is displayed in the main area: view_content_loaded

Setting up these marks is so simple that some customers ask us if these are really the only actions to take. Check it by yourself: once you have found which portion of code corresponds to the behavior you want to monitor, just add this code:

performance.mark("angular_boostrap_start");

We really had nothing more to do for Dareboost to start collecting these new data: no particular configuration, no declaration, or anything else. A few days later, we consulted our monitoring data and the data were available. We didn’t expect such results*!

Erratic timings for the userinfo_xhr_stop mark

* In fact, we did, because we already had experienced slowdowns several times, in a significant way. But seeing them on a plot is something else.

Elementary, my dear Watson!

What’s going on? The AngularJS booting phase, marked by the events angular_bootstrap_start and angular_bootstrap_end, is quite obvious. But, surprisingly, we find the context request in the middle. Actually, this is only fair: the context request and loading of AngularJS are asynchronous but, in reality, depend on each other. Indeed, the request must wait until AngularJS is loaded to be initiated. If we want a finer follow-up of this request, we will surely need to move this marker so that it better meets its purpose.

The Custom Timing of the main area comes next, which is reassuring in Dareboost’s ability to respond quickly to user demand, since it is mainly on this area that he looks at.

Finally, we see the Custom Timing of the context request response, which is unsteady and bad: almost two seconds for context recovery. Two seconds of latency is quite a long delay for a busy user! Analyses that refuse to start, potentially unavailable scenarios (because they did not have the item in the menu)… we had to fix it quickly.

Immediate action by the development team solved the problem

Immediate action by the development team solved the problem

Fortunately, the team promptly identified the back-end side issues that could explain the delay. After a minor release, the situation clearly improved:

This is how Dareboost performs now

This is how Dareboost performs now

The situation has returned to a normal behaviour, with the main contents appearing simultaneously with the determination of the user context.

In a nutshell

  • Setting up Custom Timings takes a few seconds and does not require any special configuration in Dareboost
  • Custom Timings are new indicators to understand what was invisible before.
  • Custom Timings are particularly suitable for monitoring the performance of SPAs
  • The shoemaker’s children don’t always go barefoot!

Back to static with JAMStack: a paradigm shift for better UX and web performance

For several years now, a new range of solutions have emerged in the web technologies landscape. Static site generators, headless CMS, content infrastructure… these solutions contribute to a global trend. “Static trend”, “JAMStack”, several names exist but none really covers what is an overall new proposal for web application architecture, and somehow a comeback to the roots of the Web.

Large nested metal gears

Note: this post first appeared in Dareboost’s Blog (discontinued).

Where do we come from?

When a user tries to access a web page, their browser makes a request to the server that hosts it. Either the server answers the page immediately, exactly as it is stored, or the server generates it by executing code on demand.

Although the Web was conceived as an entanglement of static files, server-side programming languages appeared very early and are now widely used. According to W3Techs, more than 80% of servers that use server-side language are running PHP. And hosting providers offering servers without dynamic language support are almost non-existent.

Yet, the dynamic generation of HTTP responses presents significant disadvantages in terms of web performance. A dynamic webpage is often built around a web server that loads an execution language that analyzes the HTTP request, often requests a database (sometimes located on another server in the datacenter) and third-party services, populates a logical model that reveals itself through an aggregate of templates to generate the HTML response. Quite logically so, Time To First Byte (TTFB) is longer.

Dareboost graph of Pages Timings monitoring. Peaks on the TTFB imply peaks on the Speed Index.

A high TTFB penalizes the Speed Index of a page.

To optimize server response time, many caching solutions have appeared over the years. The first user who requests the page undergoes the cost of generation, but the result is stored on one or more proxy servers and sometimes synchronized over different locations, all around the World. These cached pages are then responded to all similar requests, ensuring a quick and consistent delivery. Nowadays, it is possible to find software caching solutions (like Varnish), platforms and infrastructures (Content Delivery Networks). All of them ensure that what’s dynamic can become static again. The leopard can’t change its spots.

However, the use of static content has other advantages.

If you want to deliver your static pages, you must have compiled them up front. This fact, as trivial as it may seem, changes everything. Indeed, compilation turns out to be the main advantage of static: shift the complexity from the Production environment to the integration process.

If your pages are served by a web server without being generated first, you have no need for a server-side language to be executed. As a consequence, many attack vectors disappear. You can’t steal confidential data by injecting malicious code if you have neither a database nor a server-side execution language.

Not executing code on the server also means that CPU consumption is very low for each HTTP response, giving you a much better scalability. Be warned, though: as we’ll see, deployment is a key factor and can consume CPU time. Resilience is another advantage. In the worst situation, an error may occur during generation but can be detected before deployment. Technical problems resulting from a bad contribution, for instance, no longer have an impact on the site browsed by visitors. In the worst scenario, the website is not broken. Its content is simply not up-to-date.

However, these advantages are only the tip of the iceberg. The static trend allows you to completely transform the way a site is published. No wonder Smashing Magazine already migrated!

Static is a distribution modality. What’s its technical stack?

A static site generator (SSG) is a software executed locally or as a service that produces (and sometimes deploys) a static website using some data sources for model and configuration, and templates containing the business logic.

The SSG market is booming, with a new product launching twice a month. Most of them generate a website from a set of files, often written with a lightweight syntax like Markdown or Asciidoc. The responsibility for the conversion to HTML is assigned to both a templating engine (Liquid, Go Template, Nunjucks) – responsible for the logic – and a converter (kramdown, commonmark, blackfriday, Asciidoctor…) responsible for transforming the markup into HTML. SSGs are nothing more than the technical orchestrators of the website’s generation and, therefore, are mainly a playground for front-end developers who know how they tick.

Indeed, SSGs are technical tools, not substitutes for Content Management Systems. However, they become really interesting when you follow the lead of external data sources because then, we can talk about CMS that would not be used to render HTML, but only to store and expose data. They are called Headless CMS.

Headless CMS are:

A way to store data A CRUD UI An API to the data ”What is a Headless CMS?”, Chris Coyier

And they can often be obtained by using your usual systems. Wordpress, for instance, has a REST API. Drupal has a whole working group working on Headless. However, here again, the market is booming with software and services.

Why on earth would we want to separate the contributive environment and the generation tool? Because of the separation of concerns.

The development team, liberated from the burden of maintaining a database, can focus on the platform’s technical evolution and the assets pipeline while the contribution team can sharpen its content.

Contributors can work on flat files which are easy to store and modify. Their only common language with developers becomes the metadata passed in each file, often written with Front-Matter. They can use the editing tool or service of their choosing, even one that ensures collaboration. They also can benefit from source code versioning whenever they want to consult the history of their files, merge several versions or branch to write content they don’t want to publish right away.

A diagram of the contribution and development flow of a site that clearly shows the separation of concerns between developers and contributors.

Carrot (a digital agency) static CMS workflow, as described on their blog

After the contribution of the contents, the generation of the website and the deployment are often operated by the same component of the infrastructure. To monitor the performance of this step, you need to evaluate performance of the compilation server during the generation and the deployment (duration, CPU consumption, memory). But that’s not all: remember to also monitor the targeted infrastructure (consisting of one or more servers), because copying tasks can be demanding.

This means that we are no longer in a system where the main metric of scalability is the number of simultaneous visitors. DevOps must completely change their thinking to create a system that can adapt to the frequency of generation and deployment requested by contributors.

Here again, actors have emerged. Actually, the best known and probably the most effective may be Netlify. Its clean and simple interface will help you connect your source code repository in a few clicks. Then, Netlify will generate and deploy your website for each commit, on the fly.

A Headless CMS, an SSG, and a deployment orchestrator: we now have our full back-end stack. Yet, we still generate a static website with no personalized content. As the users’ demand for dynamism or personalization has never been so strong, aren’t we making a mistake?

Static? Not so much.

We have seen that this static stack produces a very standardized markup. In order to introduce dynamism and personalization, we will need to import data - delivered through APIs - and process it on the client side - hence rely on Javascript.

This new “JavaScript + loosely coupled API + Markup” stack has a name: the JAMStack and several leading actors, each of those featuring a specific set of services: Stripe for the payment, Algolia for instant search, Disqus or IntenseDebate for comments, Snipcart for e-commerce, Cloudinary or Twicpics for media management, Formspree or Staticman for forms… Note that not all of those products are designed for the JAMStack: you can perfectly use Algolia blazing fast API from the server-side.

JAMStack is a real paradigm shift. The website being served to the visitor becomes, more than ever, a shell in which services, whether self-hosted or third parties, are dynamically injected. It is even possible to rely on several services for the same purpose and switch to a fallback if the main service is not available.

And since you’re shifting a lot of your efforts to the Front End, why not go further and build your site with a Single Page App (SPA) framework like Vue, Angular or React, or transform it into a complete Progressive Web App (PWA), designed to be “offline first”? This is not inherent to JAMStack, but facilitated by the change of development paradigm.

For the user, however, the difference is small. Try to search a product on this website. Do you experience something different than from a PHP website?

For contributors, the paradigm shift changes everything as it separates the contribution platform from the one that hosts the website. Some of them will prefer to use software that features writing aids (correction, suggestions, documentary contributions). Others will be satisfied with customizable online contribution platforms. Assuming that the storage of the content is independent of the solution, each of them can use their favorite tool without interfering with others’.

Forestry.io editing interface

Forestry.io editing interface. The edited contents are saved in the files of a git repository and can also be edited with a text editor.

But some products go further and turn the contribution into a first-class experience. Contributors can take advantage of tailor-made solutions, with rich and multimedia contribution options, without any impact on the publication flow or the targeted website performance.

GIF: Prismic.io slices

Prismic.io is one of the most customizable Content Platform (here, reusable slices). Contents or layouts, everything is contributed on the platform. During the build, the SSG requests the Prismic.io API to retrieve the information.

Static or dynamic? Tomayto, tomahto

Although the JAMStack approach has many advantages, including safety, performance, scaling, development and contribution experiences, it also implies new risks that would be dangerous to ignore.

The first risk is to get lost in the plethora of Headless CMS, generators and service platforms. Take the time to evaluate your needs because each solution has its advantages and drawbacks. Jekyll, for example, is a well-known SSG, developed in Ruby, well documented but fairly slow. Hugo, on the other hand, is a much faster SSG but is also more complex to handle if you are a novice. If you don’t publish content at high-frequency, does the generation time matter so much, for an equivalent result?

Please also pay attention to the terms of use of the chosen services. At Dareboost, we often warn our users against third-party script abuses. If you need comments and use Disqus, do you agree to dynamically inject their ads? If you’ve followed our advice on Content Security Policies, you shouldn’t be concerned with that, hopefully.

Another risk but not the least: even if your website is less prone to security issues, it can still be attacked through the API it relies on. You absolutely need to ensure the scripts you use have not been tampered with and that every exchange with a third-party service is secure over HTTPS. Make sure that your self-hosted APIs comply with all the security best practices and do not hesitate to scrutinize the SLAs of the third-party services you depend on.

Finally, these APIs will also have to be carefully selected according to the sustainability of the organizations that support them. If you transfer responsibility for your key features to third-party services, you’d better make sure they will stick and maintain a constant level of quality. A good way to do this is to monitor User Journeys that are able to simulate functional interactions with your website.

A new land of opportunity

Once you have fully grasped the specific risks and put in place appropriate workflows, the JAMStack nonetheless presents its share of opportunities. The cost of migrating from Headless CMS or SSG solution to another is often quite low. You can easily switch from a local contribution on files to content infrastructure like Netlify CMS, Forestry, Contentful or Prismic, which allows you to quickly evaluate the solution that best suits your needs. Creating a static site takes time and requires an architecture that involves orchestrating several solutions. Today, it may seem complex but remember your first dynamic site: choose a host, master FTP, juggle the web server logs… none of it was easy. You will learn this logic step by step. For the experienced JAMStack users, it becomes natural.

Unified platforms such as Netlify, while presenting a risk of centralization, nevertheless offer an impressive catalog of services: website generation and deployment, DNS registration, SSL certificates and forms management, serverless functions, Content Delivery Network…

Enough out-of-the-box features to allow your Front-End team to focus on front-end development and web performance optimization. With such a low Time To First Byte, the team can fully focus on UX through the measurement of the Speed Index!


Thanks to Erin Symons, Frank Taillandier and the whole jamstatic.fr community, Bud Parr, Nicolas Hoffmann and my colleagues Philippe Guilbert and Damien Jubeau for their time and advice.


Additional Resources

Optimize your MP4 video for better performance

Representing more than 75% of the videos served on the Internet, MP4 is the most commonly used format today. However, MP4 is often used improperly, which can have an unfortunate impact on the User Experience. Let’s see how we can improve this.

A graphic

Usage evolution of the different video files types on the web. Source: HttpArchive through a BigQuery query

Note: this post first appeared in Dareboost’s Blog (discontinued).

Whether you are a luxury player wishing to broadcast extremely high-quality videos or a news platform looking for an eye-catching proposal, video has become an essential part of the Web in just a few years. But adding video to a site can be challenging.

The most widely used and supported encoding is undoubtedly H.264, served by an MP4 file. This format is supported by most video manipulation software: Handbrake, MPEG Streamclip, OpenShot… even VLC! But few of them offer a dedicated export for the Web.

However, you don’t broadcast a video on the Internet like you do on a desktop computer. There are a few things to be careful about.

VLC capture

VLC "Convert & Stream" interface

Disclaimer: the following examples will make intensive use of ffmpeg, one of the most popular video editing program among developers, but most of the optimizations should be available in your favorite software.

Reducing file weight: the right balance between quality and performance

A heavy video will cause an increase in the total page weight. Keep in mind that some Internet Providers sell packages that are limited in total bandwidth. Making your pages unnecessarily heavy will not help your visitors.

To optimize your video, you need to ask yourself how it delivers its content over the network. Even if the file size seems small, it may be possible to improve the bitrate for an optimal diffusion.

What is the bitrate? To say it simply, bitrate is the amount of data needed to encode one second of video. The more data you allocate per second, the better is the quality but the heavier is the file. I don’t have a magic formula to share that would compute the perfect bitrate. Instead, I would like to invite you to ask yourself about the quality required for each individual video usage.

For example, it is interesting to evaluate the necessary bitrate according to the abrupt changes presented in the video: the more fixed is the content, the less data you will need to allocate to each second of the video. Alternatively, if the video contains a lot of motion, the bitrate needed for equivalent quality will increase.

You can easily anticipate the weight of a video after encoding by using either a constant bitrate over the entire video, or a multi-pass encoding. Here is a comparison between an original 10-second extract of a footage from the June 2009 Endeavour liftoff and a two-pass encoding with ffmpeg. Left part weighted 85MB, right video weighted 1,2MB after being optimized:

This example shows what can technically be done to improve the weight of a video, but we can also extrapolate optimizations from the video purpose. It is quite common, for example, to visit web pages containing a large centered content banner with a welcoming message. Sometimes, behind this “Hero Container”, a background video is played.

These videos are neither intended to be viewed nor useful for conversion. They often are a subtle improvement, only intended to beautify the page and not meant to be distracting. Do you need this video to be of the highest possible quality? Using a blurring effect like the frei0r iirblur effect, you can slightly fog your original content, hence gaining precious kilobytes.

With ffmpeg:

ffmpeg -i origin.mp4 -vf frei0r=iirblur:0.4 -a:c copy blurred.mp4

The -vf frei0r=iirblur:0.4 option telles ffmpeg to blur, using a 40% factor, while the -a:c copy option tells it to keep the audio track as it is.

Result:

Another possible optimization: the audio track. If your video is not meant to play sound, why keep this track? Don’t hesitate to remove it:

ffmpeg -i origin.mp4 -an -vcodec copy muted.mp4

The -an option tells ffmpeg to disable the audio track while the -vcodec copy option tells it to keep the video track as it is. Don’t forget to also explicit the absence of sound to the browser by using the <video> element muted attribute.

Even if your video is lightweight, your work is not finished. You need to focus on the video purpose, which is quite often to be streamed.

Start playback before downloading the entire content

Here’s how streaming works: when a video playback is requested, the browser will fetch the file to find the video metadata. MP4 video metadata includes such things as display characteristics, time scale and duration. Without this information, the browser cannot start playback!

If your server is configured to accept Byte Serving, which means it has included an Accept-Ranges header in its initial HTTP response, the browser will fetch the file piece by piece through several partial content requests (HTTP Code 206) to the resource. As soon as it finds the video metadata, it will be able to start playback while downloading the complete file.

ChromeDevTools capture, "Network" tab

In this example, the browser performs three requests before obtaining metadata and beginning playback.

If your server does not support Range Requests, the browser has no choice but to download the entire file. If your video is in autoplay, the bandwidth available to download other resources needed to render the page will be reduced. The time required for the display will increase, degrading the user experience.

Where is my video metadata stored?

An MP4 file breaks down into several units of data called atoms. The metadata are contained in the movie atom movie, also called moov atom. A software such as MP4creator or AtomicParsley can help you visualize the atoms of an MP4 file.

Command-line use of AtomicParsley

In the example above, the moov atom comes after the mdat atom (4th line).

There are several methods to move the moov atom to the first position. Software such as Handbrake offers a Web Optimized option. In other softwares, this option is called MP4 “Fast Start”.

ffmpeg can quickly correct a video through the option -movflags faststart, that runs a second pass moving the moov atom to the beginning of the file (see the documentation):

ffmpeg -i origin.mp4 -acodec copy -vcodec copy -movflags faststart fast_start.mp4

If you want to learn more about the movie atom, don’t miss “Understanding the MPEG-4 Movie Atom” by Maxim Levkov.

Multiple sources for targeted performance

Although h264 is the most widely used and supported codec, it is not necessarily the most effective in every cases. We have already seen that the <image> tag accepts several sources, allowing the browser to fetch WebP images for Chrome users. The <video> element can also accept multiple sources and the WebP equivalent for videos is WebM.

ffmpeg can encode WebM files, provided it is installed with the --with-libvpx option. Here is an example of a two-pass encoding with a 1MB targeted bitrate, using the VP9 video encoder (on Windows, please replace /dev/null by NUL):

ffmpeg -i source.mp4 -c:v libvpx-vp9 -b:v 1M -pass 1 -f webm /dev/null && ffmpeg -i source.mp4 -c:v libvpx-vp9 -b:v 1M -pass 2 output.webm

From the optimized 1.2MB video of Endeavour Shuttle presented at the beginning of the article, this command generates a WebM file of 715KB, i.e. a 40% weight cut. Too bad WebM is not more widely supported.

Last pieces of advice

Be careful with the autoplay. Not only is this practice perceived negatively by many users if it is not used properly (in a subtle and unobtrusive way, behind a hero background for example), but also the video playback will always consume some bandwidth, slowing down the download of other resources.

If you want to play videos in Full HD or maximize UX, use industry-leading solutions. There is a wide variety of SaaS or appliance for managing, encoding and broadcasting content. Whether you use a streaming solution, an Online Video Platform (OVP) or an Enterprise Video Content Manager (ECVM), your users will appreciate the adaptive bitrate streaming. If they have access to a high quality network: the video is clear and the colors are rich. If their network suddenly loses capacity, the video adapts by sacrificing a little bit of quality, to keep the playback smooth. To achieve this challenge, a JavaScript script detects each user’s current bandwidth and dynamically switches the video source between several versions of a video encoded with different bitrates, ensuring an optimal user experience in any situation. If you’re interested, take a look at Brightcove, Kaltura, Qumu, etc.

Sometimes, the best video is no video. Do not hesitate to hide the video in some situations, especially if it is decorative. A well-placed CSS media query and you’ll save your mobile users from a bad experience. Also, consider supporting the Save-Data Client Hint as it is an explicit browser opt-in into a reduced data usage mode.

TL;DR

  • Reduce the weight of your files by using optimization strategies that depend on the content and purpose of your videos.
  • Optimize streaming by encoding your videos to serve metadata as soon as possible.
  • Propose alternatives to MP4, such as WebM.
  • Be careful with autoplay, consider dedicated solutions for Full HD and don’t hesitate to hide videos when needed.

Thanks to Ravana Renoncé and Rick Viscomi for their help.

Defer scripts to speed up rendering

Artists are not the only ones who suffer from a blank page, so are your users. Their frustration can lead them to abandon your page prematurely. Several techniques can help you to speed up rendering and avoid that problem. One of them is to defer parsing of JavaScript files.

A chess game before the start of a game. Zoom in on the blacks.

Note: this post first appeared in Dareboost’s Blog (discontinued).

Modern browsers are designed to render pages more quickly. For example, they scan the page as it comes in, looking for the URLs of resources which will be needed later in the rendering of the page (images, CSS but more specifically, JavaScript files). This is called a preload scan in Chrome and Safari, a speculative parsing in Firefox and a lookahead download in Internet Explorer. This feature allows the browser to start fetching the ressources while constructing its own modelisation of the HTML code, the Document Object Model (DOM) and its own modelisation of the CSS code, the CSS Object Model (CSSOM).

This is not a continuous process though, because of Javascript. As these scripts may modify HTML elements and their style, the browser stops building the DOM each time it fetch and parse a Javascript file. Afterwards the browser waits for a break into the CSSOM construction to execute the script. Since the DOM and the CSSOM are the backbone of rendering: no DOM & CSSOM, no rendering.

In this article, we will focus on what can be done about JavaScript files to improve render timings.

Capture of the Chrome DevTools Performance tab. A loading timeline displays the different steps in color. A large yellow area is surrounded by blue spots. The first image appears only at the end.

Even if the construction of the DOM (in blue) occurs mostly before the execution of JavaScript (in yellow), it only ends after. In this "default" configuration of script loading, the DOM is built very late. The display is delayed.

Distinguish critical and noncritical JS

To reduce the time to render, you must postpone the parsing of JavaScript files as often as possible. But if you try, you’ll see that it is not as simple as it seems.

Your JavaScript files are likely to contain several types of code portions and you may need to load some of them as soon as possible: JavaScript business-specific code (analytics, for example), libraries with a strong visual impact, dependencies for a third-party script that you can’t defer…

These JS lines of code are called “critical JavaScript”. Group them into an identifiable file, commonly called critical.js. Like any JS file, the browser will have to fetch, parse and evaluate it before being able to execute it.

Even if you put all the optimizations in place to reduce the amount of data that needs to be transferred over the network (cleaning the unused code from the file, minify, compress, cache on the client and server side), the browser will still need to parse and evaluate the JavaScript. As that step takes a significant amount of time, you must really keep your critical JS file as streamlined as possible.

All other scripts should then be delayed, asynchronized, or moved to the footer, sometimes several of these things at the same time. Let’s take a look at these different techniques.

Move noncritical scripts at the bottom of the page

A very simple and intuitive way to defer the browser’s parsing of JavaScript files is to place the declarations at the end of the HTML page, just before the </body> tag. Doing so, the browser will not have any knowledge of the scripts until it has almost built the entire DOM.

Although this technique appears to be suitable for most of the cases, it presents a serious drawback. Not only it delays scripts evaluation, but it also delays their downloading which excludes its use for large scripts. Moreover, if your resources are not served by HTTP/2 or come from an external domain, you will also add a substantial resolution time to the retrieval time.

Obviously, since this technique occurs at the end of the DOM construction, we also remind you not to resort to scripts that use document.write, because the browser would have to completely rebuild it.

Capture of the Chrome DevTools Performance tab. A loading timeline displays the different steps in different colors. The entire range of blue is before the yellow one. A first image appears very early in the loading process.

By pushing back the scripts at the end of the page, the completion of the display area is much faster but not definitive (a part of the content is altered by the execution of JavaScript)

How about injecting a dynamic <script> Tag?

As mentioned above, delaying the download of a script is not always the solution. You may prefer to make is asynchronous: the script is immediately retrieved without this phase blocking the construction of the DOM. Once available, the construction of the DOM is interrupted for the browser to parse and evaluated its content.

One way to do this is to not declare this script in the source of the page, but to use another script that injects it directly inside the DOM. This technique, called dynamic script tag, is the backbone of most third-party services.

One of the main advantages of this technique is that you can choose when the script is injected. If you want to inject it immediately, you can use an immediately-invoked function expression:

<script>
   (function () {
       var e = document.createElement('script');
       e.src = 'https://mydomain.com/script.js';
       e.async = true; // See the following explanation
       document.head.insertBefore(e, document.head.childNodes[document.head.childNodes.length - 1].nextSibling);
   }());
</script>

But you can also delay the injection so that it only occurs when a specific event is triggered. Here is how you inject a script when the DOM is ready:

<script>
   // IE9+
   function ready(fn) {
       if (document.attachEvent ? document.readyState === "complete" : document.readyState !== "loading") {
           fn();
       } else {
           document.addEventListener('DOMContentLoaded', fn);
       }
   }

   ready(function () {
       var e = document.createElement('script');
       e.src = '[https://mydomain.com/script.js](https://mydomain.com/script.js)';
       e.async = true; // See the following explanation
       document.head.insertBefore(e, document.head.childNodes[document.head.childNodes.length - 1].nextSibling);
   });
</script>

You may be surprised by the use of a convoluted insertBefore instead of a simpler appendChild. I invite you to read “Surefire DOM Element Insertion”, by Paul Irish.

As interesting as this technique seems, it also has its drawbacks. First, the scripts injected this way are no longer evaluated sequentially in the order of their injection. So you can’t use this technique to inject several scripts that require one another.

Secondly, dynamic script tags are not fully asynchronous. As explained in the introduction, the browser makes sure that the construction of the CSS Object Model is complete before executing the JS code of the injected script. The script is consequently not executed immediately. In order to explain to the browser that the script can be loaded without waiting for the CSSOM to be built, you must add the async attribute to the script.

But be careful: a script, even with an async attribute, is always considered as a page resource. The window.onload event will therefore be delayed by its execution. If other scripts depend on this event, you should expect a delay.

Capture of the Chrome DevTools Performance tab. A loading timeline displays the different steps in different colors. The entire range of blue is before the yellow one. A first image appears very early in the loading process.

Well mastered, the dynamic tag injection is one of the most efficient techniques with a fast built DOM and an almost immediate display. Beware, however, that the scripts are not executed in order!

async, defer, or both

async and defer are two attributes standardized by HTML5. They allow you to modify the browser’s default behavior when loading a script.

If the async attribute is present, then the script is fetched as soon as possible, then executed. The declaration order of the async scripts is not preserved: the scripts will be executed as soon as they are available. But please note that even if the script retrieval will not halt the DOM construction, their execution will do.

Capture of the Chrome DevTools Performance tab. A loading timeline displays the different steps in different colors. The entire range of blue is before the yellow one. A first image appears very early in the loading process.

Here, again, a very progressive loading. On the other hand, as for the dynamic script, we lose the execution order of the JS.

If the deferattribute is present, the script will be fetched as soon as possible, but the browser will wait for the DOM tree to be complete before executing it. Since most browsers now implement a preloader, the behavior of a script with the `defer’ attribute is very similar to the behavior of a script placed at the end of HTML content.

Capture of the Chrome DevTools Performance tab. A loading timeline displays the different steps in different colors. The entire range of blue is before the yellow one. A first image appears very early in the loading process.

This alternative visualization mode helps fully understand the simultaneous evaluation of the DOM (in blue) and the script (yellow). Even if the script execution occurs later on, some time is saved.

As for using async and defer together, it’s not very useful, except for one use case, legacy support:

The defer attribute may be specified even if the async attribute is specified, to cause legacy Web browsers that only support defer (and not async) to fall back to the defer behavior instead of the blocking behavior that is the default. HTML 5.1 2nd Edition, W3C Recommendation 3 October 2017

Loading JavaScript files: get the control back, even on third-party scripts

We have seen that there is no shortage of techniques to asynchronize the recuperation and execution of scripts. Nevertheless, some scripts still need to be declared synchronous such as A/B test scripts, which sometimes intentionally block the render to hide the content from the user until the script has customized it (as these scripts often modify the visual aspect of the site, blocking the DOM and CSSOM makes sense).

Even in this situation, you don’t have to lose control. We encourage you to choose a solution that takes web performance into account. Some serious actors like Google Optimize, Kameleoon or Optimizely limit the time allocated to the recuperation and execution of their scripts. If this time is exceeded, the browser will abort the A/B script recuperation or execution. Do not hesitate to reduce this timeout period to a minimum to ensure the quality of your visitors’ experience.

Where is the Western WeChat?

China is unquestionably changing the way Internet integrates our daily lives with its mobile app WeChat. How does this impact the web in the Western world?

A hand holding a phone in front. There are many Android apps listed in a menu.

Note: this post first appeared in Clever Age’s Blog.

WeChat is reinventing the way we use the web

WeChat is not your typical social network. It works as a platform connecting the user to a large set of services: discovery of new products, B2B, B2C or C2C interactions, reservation booking, access to information, payment, etc. WeChat offers a wide array of possibilities, as it aims to act as a single locus for a variety of micro apps, each offering a specific specialized service. WeChat is basically a service center running on top of the mobile phone’s OS.

Why hasn’t anybody developed a similar service on this side of the planet?

Facebook has tried and failed on several accounts, due to multiple factors. First of all, our market is subject to much more constraints. China’s access to the rest of the world may be limited by the Great Firewall1, but its internal market is fairly liberal. Privacy protection is in its infancy, control standards are extremely low and the occasional regulations are quite lax (contrary to the EU, whose approach is antithetical)2.

Besides, the app stores present a number of limitations. Apple’s business model, the App Store, implemented about 10 years ago and imitated by Google for Android, is the norm today and generates several billion dollars of annual revenue. It enables developers to distribute and sell their apps while also allowing them to charge their users through in-app purchases. The app store’s owner guarantees the diversity of offers while providing a coherent user experience, all the while taking a commission for paid apps sold through the store.

The rigidity of app stores

Despite its assets, the app store system is reaching its limits. The user is buried under an overwhelming offering sorely lacking context. In quite a few emerging markets, the number of alternative stores is going through to the ceiling, with some stores offering apps adapted to lower-end devices on which ‘regular’ apps cannot run.

In addition, in such a centralized system, service discovery becomes problematic. By gathering the applications offering, the app stores are making it less circumstantial, less local and less targeted. As a result, service proposal is less efficient. By offering local services based on the user and their network, WeChat provides a better system: often, instead of searching through an app store, WeChat users will directly scan a QR code giving them access to a service they need then and there.

The western wechat may already be in your pocket

So where is the Western WeChat? Well, turns out it may already be out there. We already have apps that can host other apps, create interconnections between services and Web content, offer services without having to go through the app store middle man and its unnecessary hurdles. Are you thinking of Facebook? Well, actually, I meant browsers. Google has taken advantage of its browser Chrome’s supremacy to jump on the bandwagon by massively enabling native-like web apps, and even invented “Progressive Web Apps” (PWAs), thereby disrupting its own business model – something Apple seems reluctant to do. Alphabet, Google’s parent company, finally found a way to make PWAs actual applications, including in terms of user experience (Twitter Lite, for instance, is a PWA version of Twitter which is every bit as good as its native counterpart).

The end of app stores?

Appealing as it may be, the disappearance of app stores would raise a couple of issues. It would mean the dilution of brand presence, i.e. the ability for a user to find their favorite brands in a service directory. What’s more, PWAs’ payment module capabilities are not as elaborate and comprehensive as those of app stores. That being said, Apple or Google could easily turn their app stores into PWA directories. They could keep automated quality control mechanisms (such as Lighthouse) while delegating the inventory aspect to editors. As for QR codes, which are much less successful in Western countries, they will very likely be supplemented by other discovery modes: fine geolocation, digital assistance potentially integrated into a chatbot platform, and so on. Google is also at the forefront of these issues with services such as Google Now and Google Allo.

What about payment?

Say you’re into running and looking to track your runs. Not knowing which app to install, you make a Google research and find a specialized website. Upon your third visit to the website, your browser suggests you try the corresponding app. In the app, you find a tracking tool that suits your needs. A few months later, the app warns you that an analysis of your running data revealed you may be an underpronator. In partnership with a major sports brand, the app recommends a new pair of running shoes that fits your pronation type. With your Google profile, it has access to your banking and shipping information; you smoothly proceed with payment directly through the app.

A person is sitting on the floor, she is in sportswear. The goal is focused on his right shoe, which is a running shoe.

Web, application and purchase combined into one frictionless, transparent experience for the user.

This topic will certainly define the web in the coming months, if not the coming years. It is one of the hot topics being discussed at the W3C. Soon, OS companies will likely introduce PWAs containing a set of libraries in order to facilitate and supervise payment in exchange for a commission, under a standard such as the Payment Request API. It is a substantial market and the key players will fiercely fight for their share.

Google may try penetrating this market by playing the web performance card with its AMP technology3: this alternative to HTML could be an indirect way to take control of the web and its monetization strategies (while guaranteeing better indexing capabilities at a cheaper cost, which is crucial when data is the primary resource of your activity and bandwidth is one of your largest cost centers). Unsurprisingly, payment is one of the main themes of the AMP roadmap this quarter.

All these factors strongly suggest that PWAs will gradually be integrated into Google Play’s applications offering.

TL;DR: Google has entered the race, and is moving fast

WeChat is revolutionizing the web and mobile scenes in China, but repeating the same formula in the West is not an easy task. Many players (starting with Facebook) have tried and subsequently failed. The growing presence of Chinese companies will most likely initiate a new software evolution for the web through browsers, PWAs, search engines and geolocated services – and Google (Alphabet) is at the cutting edge of these four fields.

And this new revolution cannot take place without significant progress being made in terms of web payment standards, a topic the W3C is actively working on.

  1. See Clever Age’s article: “How to operate in China?”. ↩

  2. See Clever Age’s article: “General Data Protection Regulation: Small guide for Business”. ↩

  3. On this topic, also see: “AMP Project booste le chargement des pages web” (In french). ↩

Optimize Images to Reduce Page Weight: File Formats, Tools and RWD

“Reduce the page weight”: here is one of the most usual tips in Dareboost reports. According to HTTP Archive trends, images represent 53% of the average pages weight, whether viewed on desktop or mobile devices. When you want to reduce the weight of your web pages, optimizing images should be at the top of your priorities.

On a white square are gradually designed several pixels in shades of blue, above the diagonal

Note: this post first appeared in Dareboost’s Blog (discontinued).

For each image its format

It is not always easy to find the most suitable image format. Take our logo, for example. We could save it in PNG, JPEG, WebP or SVG. The weight of the images would be very different. An empirical test allows us to visualize it:

PNG 6KB; JPEG 38KB; WebP 9KB; SVG 2.5KB (1.4KB gzipped)

In this case, the most suitable format seems to be SVG, followed closely by PNG. It is indeed an image whose colors are plain, non-animated, representing geometric shapes. All these factors tend to favor these two formats.

Let’s take a second example, this time with the photograph of a rocket taking off. SVG is just unable to represent this image correctly (we will explain why a little further). Here’s what we get, with equivalent visual perception, for JPEG, PNG and WebP formats:

PNG: 171KB; JPEG: 33KB; WebP: 13KB

Here, the results are radically different. To represent the complexity of a photograph, the WebP format clearly stands out. Unfortunately, it is only supported on Chrome and Opera, so we generally prefer the JPEG format.

Tip: for each of your web performance test on Dareboost, our tool systematically checks if the PNG format has been properly used (or if you should consider using another format).

When you want to save a JPEG, most of softwares ask what quality to retain, as it is a lossy encoding format. By choosing a quality less than 100%, it is thus possible to save precious bytes by correcting only certain points of the image. Let’s try with our image, with quality set to 80%. Then we get a very interesting result: a weight loss of more than 50%, while only a few points of the image have been deeply changed.

Original JPEG: 33KB. Optimized JPEG: 16KB. Not much differences.

As shown above, choosing a format is not trivial and not all formats are suitable for all images. Let’s explain a little more…

How to choose the right image format?

In the end, all the images appear on the screen in the same way: a rectangle composed of several dots of different color. But images are not necessarily recorded like that on the disk. And each image file format relies on different techniques for encoding visual information. In order to choose the right file format, you need to ask yourself several questions:

What does my image represent?

Some file formats encode images in the same way as they appear on the screen: like colored dot matrices. Each color point is encoded on several bytes and positioned within a map according to its coordinates. That’s why these formats are sometimes called “bitmap”. Various compression algorithms then reduce the space taken by this information on the disk. For these formats, we speak about “raster graphics”. Their advantage: they can handle any photograph and some of them, as the PNG format, come with advanced features like color palette optimization or transparency.

Unfortunately, this encoding process must define the dimensions of the matrix first, that is to say the resolution of the image, before positioning the points. As a consequence, if you enlarge an existing JPG, PNG or WebP raster graphic, you will dramatically decrease the quality.

Other file formats do not have this drawback because they encode images as a set of geometric shapes. They define an image through the lines, points and polygons that compose it. Whenever the image is to be displayed, the computer redraws it following this virtual drawing specification. These vector graphics are very suitable for rendering simple shapes, logotypes and data graphs. Since they are not resolution-dependant, they are particularly adapted for Responsive Web Design. SVG images and icon fonts are vector formats. On the other side of the coin: vector graphics are not very suitable for photographs.

Reduce the weight of images by sacrificing information

It is possible to optimize further by losing some information in the process. Of course, the challenge is to lose only the bare necessities, while maintaining an interesting level of quality. This is called the lossy optimization phase.

For vector graphics, svgo is today a reference tool. An online interface even exists: svgomg. The tool is able to reduce the amount of code by cleaning metadata that is useless for display (for example, information about the tool that was used to generate the file) but also by bringing together several geometric shapes or transformations. To reduce the weight of an icon font, the logic is the same, except that you can also reduce its scope of action by selecting only the characters used to build your custom character set. Several sites, like Icomoon, allow you to create your own icon font.

As we saw in the example of the rocket ship, lossy (or not-lossy) optimizations are also possible on the raster graphics. Since each image format has its own characteristics (for example, the transparency of PNG support), each algorithm has a different mode of action and a specific visual impact.

Here are some file formats and some suitable optimization tools. Some of them are included in graphic softwares like Photoshop or GIMP:

  • PNG: Zopfli-png, PNGOUT, OptiPNG, AdvPNG, PNGCrush, PNQQuant
  • JPG: JPEGOptim, MozJPEG, Jpegtran, Guetzli

FileOptimizer (Windows), ImageOptim (Mac) ou Trimage (Linux) are softwares that combine several algorithms in one place. They allow you to test these optimizations with various levels of loss and directly export an optimized image. They are even able to determine whenever a PNG image can be saved in PNG-8 (a variant of PNG with a 256-color palette) rather than PNG-24 to gain some precious bytes.

Why don’t you talk about GIF?

GIF is a very constrained format (it can only describe 256 colors) that supports transparency and animation. Used for years to encode logotypes, pictograms and small animations, GIF needs to – let’s say it out loud – retire for good.

You can find features stamped “GIF” in all social networks or instant messaging applications, but that’s not really the truth. In fact, many of these services use video formats, with much lighter files! We will come back to this topic in a future post.

GIF: Screencast of the ChromeDevTools. We can see a video looping like a GIF, but the code clearly indicates its a video.

If you still need the GIF format, be aware that a command-line compression tool also exists: gifsicle. It can be very useful for manipulating GIF content: reduce the color palette, resize, cut and crop… I sometimes use Gifsicle to encode short recordings of my screen and integrate them into emails, because many mail clients are not able to read embedded videos.

Serve the right file size regarding to the context

Choosing the right file format is not enough to ensure that you will serve the optimum image each time.

Imagine that you are using a 2680-pixel wide image to decorate the background of a site designed for a computer with high-resolution display (HiDPI, including Retina™). On a mobile device of lower resolution, in 3G, not only will the browser load a lot of unnecessary data but, the browser will also resize the image with its internal algorithm for the image to fit in the width of the phone screen. The final result will be degraded, not to mention the rendering latency… Instead, you would rather produce several versions of the original image, in different resolutions and let the browser choose the image to download, depending on its execution context.

“Responsive Images” is a denomination that embodies all the techniques that consist in producing, for the same area of a Web page, several images adapted to the possible contexts of navigation. For background and decorative images, you can use CSS media-queries.

For non-decorative images, the picture specification has added the attribute srcset to the <img> element in 2014 (yes, three years already!). The srcset is a collection of URLs pointing to multiple versions of the same image, with different resolutions (but still the same width-to-height ratio). It gives the browser the responsibility to choose the version of the image to download, depending on the current context. Unfortunately, without having downloaded the CSS files from the web page, the browser can not understand the relative space occupied by the image in the window, so the sizes attribute must also be defined.

If you want to offer, in addition to your optimized image, formats supported by a limited number of browsers (such as WebP) or if you want to manage different width-to-height ratios depending on the context (a matter of artistic direction), you can frame your image with a picture element and several source elements:

Code capture

HTML markup for Responsive Images, from The Guardian website<

With all possible media, art direction alternatives, resolutions, pixel densities, and supported formats, the HTML markup of responsive images can become very impressive. But do not forget that your HTTP responses must always be gzipped. Finally, the difference of 500B between this markup and a single element img will be largely offset by the reduction of the weight of the delivered image.

Note that even if the support for the necessary HTML elements is fairly recent, a reliable and recognized library allows support on older browsers: picturefill.

Automate, automate, automate

Choosing the right image format, generating thumbnails, sometimes using alternative formats that are more adapted to the context (like WebP) and thus generating yet again some thumbnails… Manually perform this work on a large amount of high-quality master images is titanic. Very few tools, whether they are WCM or e-commerce platforms, include advanced features on image management. Even Digital Asset Management solutions, which are normally dedicated to visual asset management and where Responsive Images management should be a prerogative, are often useless.

Nevertheless, some solutions exist, like Cloudinary – a third party service available in SaaS – or Thumbor (an appliance that you need to install on your network). Discuss with your web development team to determine the best tool and remember to explain the issues to the contributors and train them to the chosen solution. Do not forget to always keep the original images (those of the best available quality) and to think up ahead about the optimizations, even lossy, that you want to apply.

For example, on an e-commerce website, photos of products are more critical than decorative images, so you will not want to lose too much quality. Similarly, if you are in the luxury market, your visitors expect an impeccable image quality. You will need to fine-tune the configuration of your optimizations. Sometimes, as was the case with Flickr, the right setting may take several months to emerge.

Lazy-load what you can (with or without visual effect)

Another way to improve the performance of a web page is to avoid unnecessary images during initial loading. For example, you can delay the loading of all images that are not displayed in the visible area of the web page (Lazy loading). There are many JS libraries to do this but some of them will not be compatible with your existing code: ask your development team for advice or suggest an independent, vanilla library like Lozad. A lazy loading feature is also available on Apache and nginx: ModPageSpeed Lazyload.

One of the problems with Lazy Loading is the sudden display of the image, only after it is loaded. It is therefore necessary to determine when and how to load the delayed images so that the user does not notice this phenomenon. But when? After the initial loading (onload) of the Web page? When the user scrolls through the content and the viewport is approaching of the considered area? The lazy-loading needs to be discussed with UX designers who may have ideas on how to animate the appearance of the image, to make it less harsh. Some websites occupy the area with a branded content. Others use the main color of the image or even a shape of the actual image in SVG.

GIF: Progressive image loading: while images are loading, a fuzzy silhouette occupies the space.

Reduce the number of images with an image stack

On high-latency networks, you can quickly save time by reducing the number of images to download. Rather than including each image in a separate image file, the images can be grouped into a single file. Image Sprites are an example of this technique applied to raster images. Icon fonts and SVG symbols are the equivalent implementation for vector images.

How attractive could seem this idea, its implementation can be complex though. Using an image sprite is a useful technique if you really use all the grouped images on the web page loading the resource, which is quite rare. In addition, if you need to replace a single element in the stack, note that you will need to invalidate the entire sprite from the browser cache.

Finally: latency may not be an everlasting problem. With HTTP/2, a protocol in which connections are optimized to download multiple resources simultaneously, the technique would lose its meaning. Theoretically speaking.

The end?

Heck, no! The state of the art of (responsive) image management is still far from perfect.

For example, instead of sending a lot of information to the browser and let it choose the right image regarding the context, why not ask the browser to pass the context during the initial query and calculate all the contextualization server side? This is what some members of the What WG are thinking about in the “Client Hints” specification. Support is still very limited but the concept is being standardized at the IETF. This is very much like an early 2010 initiative, called Responsive Web Design + Server Side Components, aka RESS, which was already trying to implement server-side mechanics.

Will it succeed this time?

Ensure secured connections with HSTS (HTTP Strict Transport Security)

Our regular readers of the Dareboost blog already know that HTTPS is now a requirement for any websites. The urge to get rid of unsecured navigation has never been stronger: each release of Google Chrome or Mozilla Firefox comes with a new warning sign for users sharing private data. Soon, all forms will be concerned.

But offering an HTTPS version of your website is not enough to automatically redirect all your HTTP traffic to this secured version.

Along a railway switch, a two-color light indicates if a train can pass.

Note: this post first appeared in Dareboost’s Blog (discontinued).

Implementing a redirection: a limited solution

One of the most efficient way to redirect traffic is to use a permanent redirection (HTTP code 301, with a Location header containing the target URL). That way, users and search engines are instantly redirected to your HTTPS website for every HTTP request.

Is that enough? Unfortunately, no. Because that redirection will not change, for most users, the first action that drove them to request an unsecured URL. Some of them may have directly typed the URL with http://, others clicked an icon within their favorites bar or have followed a link located on a third-party website. You are even not self-immune from forgetting a couple of internal HTTP links into your own HTTPS website! In all these cases, redirecting is not enough to guarantee a secured traffic for your visitors. Furthermore, each redirect affects your web performance.

Moreover, redirecting one user to a secure version implies that an unsecure page has been called/requested first. During this initial request, navigation is likely to be captured. If a malicious person is able to access to your visitor’s network, he will be able to intercept the traffic and, worse, divert it to steal confidential data. Some of your visitors may be at risk, visiting your website from public Wifi hotspots, internet connections provided by transport companies (which are sometimes the first to inject content into unsecured traffic), or a compromised private network…

You need to avoid as much as possible this kind of redirections, for both safety and performance.

HSTS to force HTTPS

HTTP Strict Transport Security (HSTS) is a directive specified in RFC 6797. The security policy is transmitted by the server to the user agent via a header response declaring that for any further call, this domain should be requested over HTTPS.

The browser (or any other user agent) stores the information then every new unsecured request to any URL of this domain will be automatically rerouted via an internal redirect (HTTP code 307) to the HTTPS scheme. Please note that the 301 redirect remains necessary, as the directive only considers future calls.

The HSTS directive must have an activity period defined by the max-age parameter, in seconds. A 300 value will instruct the browser to memorize the internal redirect for five minutes. A value set to 63072000 will keep the redirect up for two years.

We highly recommend you to implement HSTS with a small activity period first, and then increase it step by step. At each step, make sure to wait for the defined period, detect the errors through observation or your analytics, then fix the issues and continue.

Here is an example of HSTS implementation with Apache, for a 5-minute activity period:

Header always set Strict-Transport-Security "max-age=300; includeSubDomains;"

The includeSubDomains parameter indicates that HTTPS is available for all the subdomains of the current domain. Please make sure that all of your assets are available in HTTPS before applying this switch or your assets will become unreachable.

Do not worry. If you make mistakes, you can deactivate the HSTS policy by setting a “0” value to the max-age.

A max-age value of zero (i.e., max-age=0) signals the UA to cease regarding the host as a Known HSTS Host, including the includeSubDomains directive (if asserted for that HSTS Host).
RFC 6797, Section 6.1.1

In a nutshell, the HSTS directive can be used in addition to a 301 redirect to secure all future requests on a domain (and eventually its subdomain) from a user over a specific period. One security issue still remains, though: the initial request is still unsecure.

HSTS Preloading to reliably secure the exchanges

To secure even the first request, the Chromium Projects maintains a list of valid HSTS domain that is hardcoded into Chrome as being HTTPS only. Firefox, Opera, Safari, IE 11 and Edge also have their list derived from this one.

In order to be accepted to the HSTS preload list, a website has to meet the following set of requirements:

  1. Present a valid certificate.
  2. Automatically redirect from to HTTPS on the same host
  3. Serve all subdomains over HTTPS
  4. Respond an HSTS header on the base domain for HTTPS requests:
    • The max-age must be at least 10886400 seconds (18 weeks) 31536000 seconds (a year)1.
    • The directive header must include the subdomains.
    • The preload directive must be specified.
    • If you are serving an additional redirect from your HTTPS site, that redirect must still have the HSTS header (rather than the page it redirects to).

If your website is eligible, you can submit its domain for inclusion over this form.

A screencapture of Chrome DevTools

Internal HTTPS redirection of a request to Facebook made over HTTP, Chrome 60

Beware: the modification of the directive with a 0-second max-age will not switch off HSTS preloading. Domains can be deleted from the HSTS Preload registry but you will have to wait for months since the next update of the browser needs to reach all the users. So, a word of advice: do not register for HSTS Preload if you are not strongly confident into your capacity to offer HTTPS on your domain and its subdomains over time.

Protect your users with HSTS

The HSTS directive exists for several years. It can secure requests and response between your server and your visitors’ browsers. The first request can be secured with HSTS Preloading, ensuring that all traffic is protected against threats. HSTS must be activated with caution but when it is done, user experience do not suffer from extended request time. As Google value security, HSTS is also an optimization for SEO.

Bonus: with HSTS Preload, protect your domain from SSL strip attacks

If you watch closely at InfoSec news, you may have noticed the danger represented by Krack Attacks, the demonstration of a serious weaknesses in WPA2, a protocol that secures all modern protected Wi-Fi networks. One of the steps in the attack procedure is for the malicious software to intercept the SSL requests sent by the browser, request the URL itself, then answer the result in HTTP instead of HTTPS. A simple off-guard moment is enough for a pirate to intercept private information. If your domain is indexed in the HSTS Preload list, the browser will refuse to switch to HTTP, thus protecting your visitors.

Further information about HSTS

  1. The value was 18 weeks when I wrote the post. It has been changed to a year between october 11th and october 16th. Thanks to @Thibault_Walle for pointing that out. ↩

(Web) Apps: There is no silver bullet

I recently read an article that proclaimed the end of mobile apps, insisting that RWD (Responsive Web Design) and Progressive Web Apps (PWA) were the answer to all companies’ needs. The author was using app downloads figures to support this allegation. As Frederick Brooks said, there is no miraculous technique (no “silver bullet”) in software engineering. Using figures is not so simple and there are many traps that can lead us to false conclusions.

Let’s take a look at the different logical biases related to this topic.

Note: this post first appeared in Clever Age’s Blog.

Web or native?

Let’s imagine that we want to evaluate the user satisfaction for various applications: pure native applications, cross-platform applications, semi-hybrid applications with React Native, “installed” PWAs on Android 6, not-installed PWAs and non-progressive Web App. With these measurements, we would be able to produce a graph with the level of satisfaction on the x-axis while the y-axis represents how close to a “native application” the app is.

Our first graph shows the user satisfaction for each group of application depending on the app technical similarities with native applications.

Our first graph shows the user satisfaction for each group of application depending on the app technical similarities with native applications.

It is hard to make any precise conclusion, however we can identify a global trend by analyzing the average satisfaction of each group of applications: the most “native” apps seem to be more likely to generate satisfaction.

Depending on the type of application?

Now let’s imagine that satisfaction depends on the type of application. In other words, the satisfaction now depends on the category in which you would place each application on an application marketplace.

A second graph where it's clear that the trends are very different depending on the application type

So it’s not so easy, right?

Trends appear to be less obvious.

We quickly realize that the displayed categories are very limited. There is no social networks, for example. So here we have an extremely fragmented view of the market, which can significantly change the relevance of the previous conclusions. This bias is very common in studies that I read here and there. Be careful.

For the sake of the argument, let’s assume that this is not a problem for us (in this scenario, we are interested in these exact types of applications) and let’s continue the analysis.

Depending on the category, the relationship between customer’s satisfaction and the application type is not the same: the best productivity tools and the best games, for example, seem to be appreciated when they feel close to the native feeling. On the other hand, cooking applications which are “native” do not seem to be appreciated by customers. This observation makes sense if we look closely at the application technical requirements: productivity tools often need to read of write files, therefore need a performant way to call the operating system features. In the same way, games need power and a good control of parallel programming, that’s why they are developed to the closest of the operating system.

Having said all of that, we could think that we should be able to find trends by applying common sense logics to all categories. A game would always be better as a native application whereas a cooking website would be better as a WebApp… But quickly, we realize that this logic does not work for all categories. E-Commerce, for example, does not seem to be affected by the type of applications…

What about budgets?

What if the applications do not receive the same funding according to their type or their development platform? We’re going to analyze this possibility and compare the budget allocated to each type of application.

This time, we can also read the estimated cost of every app. Native apps seems to cost more, but it is still difficult to correlate data.

Still not obvious, huh

Native applications seem to cost more, which is understandable: they need to be developed on two or three different systems whereas cross-platform or web development can easily be used on different hardwares. But this statement is not an absolute. On this graph, we can see that a high cost for a semi-hybrid office application. It’s impossible to know if this cost is a chosen investment or if it’s the consequence of a bad choice of technology coupled with stubbornness.

We can also notice another visible trend: we found high costs for eCommerce applications. But we don’t know if it’s because eCommerce applications are more expensive to develop or if it’s because the return on investment is judged more promising.

But then, numbers don’t mean anything?

Numbers are very difficult to interpret because causes and effects get muddled up when you mix an underlying technology and a functional need. We have a real paradox here, called the “Yule-Simpson paradox”: regardless of the constituent groups (price, objective, satisfaction…), the different correlations observed are not consistent with what is observed in each of the groups. There is a lack of information that influences all factors.

There is a good example which could illustrate this problem, an example that I would call “the impossible application”. Imagine an application that will require all your skills, your teams’ time and an open access to the native features to create the perfect UX.

So you mobilize your teams, the development is long and expensive and… you fail. Nobody likes it, it’s not successfull. You have a perfect example of an application that is expensive to develop, a development which you would never have tried with an hybrid technology but which skews statistics and make you believe that the “native” was not the right solution. Here is the reality: we do not expect the same thing from a native app and an hybrid one.

We can imagine another good example: a client who needs to highly control his application interface. But he doesn’t judge relevant to invest in a cross-platform development because he says that ⅔ of mobile users never install applications other than social networks. However, its application was intended for a B2B target which was required to install the application for administrative purposes. This specific target and acquisition strategy completely invalidated the previous statistics.

An overall vision

In order to make good decisions, we must approach each project as a whole: functional and technical specifications, target analysis (age, socio-economic classification, location, culture …), information and skills level of the teams, existing development platform or acquisition capabilities, sustainability of the development, expected turnover, deployment and maintenance strategy…

For now, there is no Big Data algorithm able to take a step back from a need that, most of the time, the sponsor himself does not know how to formalize. It’s still necessary to spend time refining the need, analysing it, and to determine, every time, the different solutions (which can not be only technical).

If you want to say that the PWAs are promising and it’s time to get interested into them, go ahead (I surely believe in them myself). But I won’t say that we must, each time, give up the native applications and market places.

Whether you have doubts or not, get advice from people who have experience, who are knowledgeable and independent of the technologies employed.

Death: the trivial way

On the one hand, it’s possible we’ll develop ASI that’s like a god in a box, bringing us a world of abundance and immortality. But on the other hand, it’s very likely that we will create ASI that causes humanity to go extinct in a quick and trivial way.
”AI Revolution 101”, Pawel Sysiak

Even if I’ve studied it, I’ve never been interested by AI before. As the computer power continue to grow, I think that it may be possible we achieve AGI, even accidental ASI, by the end of my lifetime.

We need to discuss about it.

My feedback on the Opquast certification

The Opquast repositories and Clever Age are a love story that has lasted for several years. Many consultants have collaborated in writing them, and there are enough internal discussions for everyone to know what they are about.

The word &quot;opquast&quot; with, below, &quot;certified&quot;. On the left, a abstract logo in shades of green.

Opquast Certified® Logo

In September 2015, Olivier announced on the Clever Age blog that each consultant could, if they wished, have access to the Opquast Certified® training platform. I just had time to get organized and I accepted his invitation last month.

Immediate feedback

I was surprised by the amount of information

I was already familiar with the Opquast checklists. I had used them for audit missions and I had even participated in the development of guidelines for a checklist dedicated to Web Performance. So I opened the “Web Quality” book thinking that I probably knew what was in it. Let’s be honest, I was wrong.

In addition to the label, there are explanations on the root causes of each of the best practices, its objectives, notes on how to validate it, and even anecdotes based on real-life cases. Reading the book was more interesting but also slower than I had imagined. My first piece of advice, then, if you want to take the certification: set aside some time to read with a clear head and take notes. The material is dense and deserves your attention.

The “training platform” is a full-featured MOOC

I was under the impression that the training platform will just be a series of small quizzes to get the hang of the checklist. It was a mistake. Of course, the little quizzes were there but also many articles about web quality, project management, user perception… which made me take a step back on the objectives and understand the more global context in which the web Quality is embedded.

I thought I could arrange myself several 15-minute sessions on the platform, but in fact, it’s better to reserve longer sessions of more than an hour and to challenge yourself to pass the certification in a limited time to be sure you don’t “slip” your training schedule.

I found the Opquast Certified® course exciting

I had three fears when I started the training:

  1. That the training would be limited to HTML best practices related to accessibility.
  2. That the rules are too simplistic, disconnected from reality.
  3. That it would contain, as is often the case in certifications, many things that are not directly relevant to my job.

Instead, the training does not impose its way of thinking but subtly puts forward relevant arguments, anchored in reality. It covers a wide variety of subjects without ever going too deeply into implementation details, without ever overwhelming the reader who would not feel concerned. Even better, the materials regularly emphasize the hindsight required to assess the relevance of the practices. In short, Opquast Certified® encourages reflection.

I realized how much it echoed my current position as a project manager. When talking about skills, you both need to be a jack of all trades but also to understand how the sausage is made, aka how a project is governed: with pragmatism and method, to achieve a goal that is rarely technical.

In fine

I think (and hope) that nowadays, the perception of Opquast Certified® is very good among front-end web developers. But this is not enough. Opquast Certified® is actually relevant for any profile that cares about user experience, at any level of the production chain. The technical requirements are very low but the certification is demanding and the exam is relatively difficult. So I think it will naturally become a benchmark for web investment by digital companies. We all have something to gain from it.

An Opquast certificate composed of 5 stars, with the word &quote;Expert&quote;
Web Quality Certificate - Expert Level

Online Advertising: The Current Status
A Multifaceted War

Online advertising has become — for lack of a better solution — the main source of income for many content producers.

Note: this post first appeared in Clever Age’s Blog.

In the absence of any regulations, online advertising increasingly oversteps the blurred lines of privacy, at the expense of users who then express their feeling of being abused through massive resort to ad blockers1. A true ad blocking market is emerging, consisting of technical solutions and secret agreements, in browsers as well as on smartphones2. Faced with this phenomenon, some online editors no longer hesitate to block access to their content to users running ad blockers, which sends a very negative signal to their audience.

This war is extremely costly and is the result of a gamble on alternative sources of income (based on advertising) rather than promoting the real added value of content. Many players are actually giving in to “everything-for-free” mentality, mass-producing content with low informational value and maximizing advertising revenues through real clickbait with no editorial line. Empires are built, going as far as acquiring websites to spread advertising trojans, to the detriment of historical readers, who are rarely fooled by this.

These quantity-based approaches devalue content and reduce its advertising value. Editors who used to ensure their profitability with just a few ads now find themselves with a knife at their throats, and they are forced to resort to technical hacks (thwarting ad blockers) or editorial meddling (inserting native advertising or advertorials among their engaging content) to keep the money coming in.

To make things clear, this solution has become so unacceptable that even the online advertising industry, represented by the IAB3, confirms it:

We messed up. As technologists, tasked with delivering content and services to users, we lost track of the user experience.
Scott Cunningham in Getting LEAN with Digital Ad UX

Challenging Alternatives

Developing a paid content offering is an ambitious project and many such initiatives never achieve profitability because most Internet users like to consume free content but rarely purchase any.

However, if the message gets across, there are solutions allowing Internet users to voluntarily fund content production through donations Flattr, Google Contributor. Yet they would not be possible to use on a large scale due to the sheer number of agencies to pay. Another avenue is being explored by French platform La Presse Libre: bringing together multiple content producers on a single platform (with donation- or subscription-based funding) and then reallocating funds, for example in proportion to the number of visits. This type of system is also difficult to set up because it requires common metrics, consistent information systems and an enormous amount of trust.

In contrast to this unity approach, some players are showing alternative avenues by developing offerings with a value that is more intelligible to users: editorial independence (e.g., French online journal Mediapart, entirely subscription-funded), an enhanced reading experience (e.g., LaPresse.ca native app), summarized and curated information… What they all have in common is that they emphasize what has been overlooked — i.e., the fact that investigative journalism, content writing and access to information all have a cost, on the Internet as elsewhere — and they all very rarely offer free access to their content, except for promotional purposes.

Leveraging Audiences

If, on the one hand, content producers are unable to promote their content for lack of sufficient audience and, on the other hand, some platforms have an audience but hardly any content to offer, then why wouldn’t the latter offer their services? This leads to the emergence of new solutions allowing editors to integrate their content on platforms enhanced by their audience, but in return content producers become reliant on a new channel. This relationship model brings new challenges:

  • content is visually sober, which improves readability but weakens brand identity and loyalty;
  • audiences are potentially very wide, but editors have very little impact on targeting and on their ability to reach their targets (this is the same marketplace approach as with Google Adwords);
  • Monetization is simplified, but in exchange editors generally have no control over advertising contracts.
Facebook (Instant Articles) and Apple (News) were the first to embark on this type of offer, closely followed by Twitter (Moments) and Snapchat (Discover), but with the lack of transparency on these platforms, nothing suggests that content producers will be able to actually control their targeting. Facebook, for one, no longer shows all of your friends posts in your news feed*.*

Will you trust it for your articles?

Google AMP: Change the Packaging, Keep the Content

In contrast to the aforementioned players, Google’s positioning is different. It is no secret that the search engine giant primarily specializes in content indexing, so it comes as no surprise that they would launch an initiative such as Accelerated Mobile Pages (AMP). Google AMP uses a custom version of HTML and makes it possible to bundle lightweight content together with advertising (via Google) and the related analytics. Google provides the market with a new format and will be scrutinizing whether it is adopted as the “standard” that is finally capable of solving the equation { readability × monetization × control }.

Obviously, Google’s interest is to increasingly centralize information by displaying results directly rather than redirecting readers to the content producer’s website. Another benefit is that with its rational approach to advertising, Google can engage in dialogue with major ad blocker software companies and promote the concept of acceptable ads.

On a technical level, the approach is straightforward. Most CMSs can generate syndication feeds. There would simply be an additional feed that would include tracking and advertising campaigns. WordPress is already liaising with Google on that topic.

From a business perspective, however, this approach is more than likely to worry professionals who would find themselves deprived of the control they now have over agencies. In this context, it is hardly surprising that they swiftly gathered around a mea culpa posture and that they prefer reaching consensual agreements based on best practices.

Unexplored Avenues, a Lesson for the Future

So what does the future hold for content monetization? No one really knows for sure. What is certain is that the harmful potential of ad blockers is driving the industry down a blind alley, forcing it to rethink business models towards more reader-friendly practices, such as L.E.A.N.4.

Many alternatives to the traditional advertising model are being contemplated, considering for example that the reader’s attention must be entirely focused on evaluating the quality of the content they are reading, but that in the meantime their device is idle. This means that human attention span can be traded for computing power, e.g. to generate cryptocurrencies for the content producer. But for now, security is mostly insufficient and large-scale deployment would be very complex.

The moral to remember is this: advertising is a concept that arises entirely from the refusal to consider that content has a cost. We are reaching the limits of this system, and one day we will also reach the limits of other so-called free systems such as social networks.

If you can, always prefer business models based on the added value of your content rather than offering it at a low cost or for free: you are sending the wrong signal and it is hard to move away from this model afterward.


About the same subject:

A few links suggested by readers:

  1. According to a survey by PageFair, these ad blockers would be installed on the computers of 35% of European Internet users and 41% of 16-29 year olds. UCBrowser and Maxthon, who claim more than 600 million users in Asia, are also partnering with ad blocking solutions. ↩

  2. The ad blocker of iOS 9, for example, relies on a business model in which advertisers must pay to have their ads displayed. ↩

  3. The Internet Advertising Bureau is the leading association for online advertising professionals, bringing together many players in the advertising ecosystem: creative agencies, media sales agencies, partners, hosting service providers. Generally the IAB massively promotes online advertising by funding studies on its effectiveness. This acknowledgement of failure is a real earthquake in the industry. ↩
  4. L.E.A.N. — for “Light, Encrypted, Ad choice supported, Non-invasive ads” — is a new best practice put forward by the IAB. ↩
Expert or not?

In a company, a skill is rarely absolute; it’s often evaluated based on know-how, soft skills, or communication skills that can only be measured in relation to others. From novice to expert, you have to manage different levels of intuition to build the best teams—those that allow everyone to thrive at their targeted skill level (which isn’t necessarily the highest in terms of expertise).

Several classifications exist to define skills. Today, I’m going to talk about the Dreyfus model of skill acquisition.

The Profiles

The Novice

They have little or no experience and their primary goal is to get results quickly. To do this, they expect clear explanations of constraints and absolute rules to overcome them and perform simple tasks. Successes quickly build their confidence, but they are easily disturbed by anything outside the nominal case.

The Advanced Beginner

They continue to focus on tasks but begin to gain perspective on the context, extrapolating from examples. This also allows them to gain perspective on their own skills and start to assert what they know how to do, and to consider what they still need to learn. Their execution still relies heavily on rules and instructions. In case of failure, they will easily blame their errors on these rules.

The Competent

By classifying and sorting their experiences, the beginner creates perspectives. When they start to choose the right perspective themselves, they become competent, take control of the situation, and take initiatives (emancipation through an instinctive vision of the solution). This phase requires overcoming their fears, which also brings the management of their emotions into the decision-making process.

The Proficient

They rely increasingly on intuition to recognize situations, trusting little or not at all in the sets of rules and maxims they know. They take an extra step back and begin to understand where the rules come from. Finally, they are able to enrich their knowledge through the feedback of others: they effortlessly transform information about acquiring know-how into information about soft skills and find it increasingly difficult to distinguish between the two.

The Expert

The expert reacts entirely intuitively, making the right decision directly. They are no longer conscious of the mechanisms that lead to their decision; they act by reflex. They are capable of analyzing their actions, but it requires effort: it is more natural for them to act than to explain or pay attention to how they behave.


Balancing a Team

In the Dreyfus model, there is no good or bad position, but rather an uneven distribution with a few novices, many advanced beginners, few proficient individuals, and very few experts. Expertise is almost entirely evaluated based on a person’s intuition, with beginners preferring the execution of rules. But this intuition comes at a cost: communication. Therefore, it is not advisable to directly group profiles with more than one level of difference. For example, there’s no point in putting together people who need many answers (novices) and people who are unable to provide them (experts).


Other Models?

Many other models exist, but I like this one because it easily debunks what we call an “expert” in the digital world. Very often, this is someone who knows their subject very well but is still capable of explaining things, or even enjoys doing so. In the Dreyfus matrix, this would therefore be more akin to a competent person.

I’ve met few true experts in my professional life, and I’m far from considering myself one of them on any subject, but since everything is relative, I’m surely someone’s expert (and someone else’s novice).

I try to always keep in mind that each skill must be evaluated individually and that one can be competent in one area and a novice in another. For my part, the highest degree doesn’t excite me: I love explaining what I do too much!

Conquering A/B Testing

Matthew is not the kind of person who takes decisions lightly, especially when it is likely to impact his company’s revenue. He likes to try before he buys. This is why he decided to get into A/B testing.

Note: this post first appeared in Clever Age’s Blog.

A Story About A/B Testing

Matthew is not the fussy type, really, but his responsibilities and professionalism command him to monitor any evolution of his company’s website, in order to ensure that all key indicators improve with each delivery.

A pen writing a question mark on a paper

"Questioned Proposal" by Ethan Lofton - CC BY 2.0

But sometimes, let’s face it, Matthew is not sure. He hesitates. He wonders: will this new feature improve user experience? Will this new communication strategy motivate more customers to visit our website? And this new payment funnel, is it really more efficient than the old one?

A/B Testing Is Simple and Objective

To improve his decision-making process, he does some research and discovers a methodology widely adopted by Internet giants: A/B testing. He reads the Wikipedia article with great attention and immediately understands the principle, which consists of three steps:

  1. First, he will need to deliver two versions of his feature and direct some users to the first one (version A), and the other users to the second one (version B);
  2. At the same time, he will need to make sure he can collect user experience data on both versions. For Matthew, this means adapting his analytics markup to be able to differentiate measurements from each version;
  3. Finally, the analysis of these figures will allow Matthew to establish statistical facts regarding both versions and determine which one provides the best results according to his criteria.

Full of confidence, Matthew looks for a few examples to help convince senior management. For example, he discovers the incredible but true story of Marissa Mayer (then a Google executive), who had asked her teams to deploy 41 shades of blue on a website in order to determine which one was the most effective with users. If Google can do it, then Matthew should be able to do it too. It even looks easy.

A/B Testing Is Complex and Subjective

Matthew is thinking about concrete implementation steps. His first constraint is the difficulty to set up two simultaneous versions. It is a strong constraint for Matthew, who realizes that he will not be able to run as many A/B tests as necessary: his company’s IT infrastructure is limited and he cannot request new servers and gateways to extend the architectural framework as much as he would need to. Nevermind that, he decides to make the move anyway and sets his development team to work. He specifically chooses an alteration that does not require any change in infrastructure: a visual variation within a page.

A wireframe of the product page of an ecommerce website

Product page template: the yellow area will feature either a picture of the product (version A) or a video (version B)

After hesitating for a while, he finally decides to evaluate the display of the product image on the “Product Page” template of the e-commerce website. The current version, with the product image to the left of the description, will be considered as the control version (version A). On version B, a video of the product will be displayed instead. The Marketing Department has been insisting that we should use more video, the time has come to verify these claims! But an analytical problem then arises: how can the effectiveness of one version over the other be measured? Many indicators can be used to evaluate user experience: successful sales, abandoned carts, time-based measurements, bounce rate measurements… After careful consideration, the team makes a choice: the add-to-cart action will be the criterion for a successful version. The more a product gets added to cart, the more effective the version. Next arises a technical problem: for the sake of consistency, Matthew wants that users who have been directed to a specific version stay on that version for the entire duration of the test — displaying either a picture or a video completely at random is out of the question! So the team creates a cookie that will store the appropriate version for the current visitor at the time when that version is assigned. For each visitor, the system will then test whether the cookie exists and if it does, it will display the relevant version. The last step is to decide which version will be displayed on a customer’s first visit. Again, a choice must be made regarding the way users are handled: What proportion of visitors will see version B? Based on what criteria will they be selected? What area of the website will be affected by the test: all product pages or only some of them? To avoid influencing the results, A/B testing methodology requires using a completely independent criterion, but finding one is not so easy! Matthew and his team finally decide to use a random assignment approach and display the control version to 99% of users and version B to only 1% of them, on the entire site. This means that if version B does not fulfill expectations, the impact on business will be limited. Matthew realizes that, under the guise of objectivity, the team has made a number of highly subjective choices:

  • the nature of the test itself;
  • the way of measuring how successful each version is;
  • the way in which visitors are sorted and distributed.

In the end, A/B testing is not that easy. Oh well, too late to stop now!

A/B testing starts where it ends

Matthew decides to run a test over a few days. The results are as follows:

Version Number of visitors Number of add-to-cart clicks Add-to-cart clicks / visitors ratio
Version de contrôle (A) 34 217 6234 18,21%
Version avec vidéo (B) 327 68 20,79%

A quick look at the ratio between the number of add-to-cart clicks and the number of visitors seems to suggest that version B was more effective than version A. Unfortunately, traffic was lower than expected and the sample is very small. Hard to say if this sample is sufficient to draw general conclusions from these results… On top of that, one of Matthew’s team members brings in new information: due to an error in the random assignment algorithm, visitors entering the website from the “High-Tech” section were selected for version B more often than other visitors. However, the “High-Tech” section has one of the best conversion rates on the entire site. This means that the nearly 3-percentage-point difference they observed may not be related at all to the modified product page. Matthew and his team are skeptical. Finally, over the few days during which the test took place, the site’s overall conversion rate dropped. Since he did not include A/B markers in his indicators all the way to the payment stage (only add-to-cart clicks stored this distinction), Matthew is struggling to determine whether version B is in any way responsible… What if people added more items to their carts but ended up leaving the site without purchasing anything? This is a risk the team cannot take lightly. Matthew is learning a lot of things… about how to run A/B tests. But regarding the product page, no conclusion can be drawn: the experiment must be conducted again, this time with more control.

A/B testing, when more people get involved

Eventually, Matthew and his team perform a new test with better measurements and a more significant volume, allowing them to isolate the results. Contrary to their initial impressions, version B is less effective. The website is completely rolled back to the version displaying a product image. Even though Matthew is frustrated about not understanding the reasons behind this result — since he thought video could only be more appealing — he is still satisfied with what he has achieved and he receives praise from his superiors. As they are reveling in their success, Matthew’s team starts receiving an increasing amount of test requests, mostly from their marketing colleagues who have found in these tests a great way for measuring visitor activity. But many technical problems emerge because some of these tests, which seem rather straightforward on paper, actually require maintaining multiple software architectures that are not compatible with each other. Matthew and his team have to put these tests on hold while they rewrite parts of the code to be able to inject dependencies. At the same time, other requests — also on hold for an unspecified period of time — require changes to the technical infrastructure. So many expenditures that were not budgeted… Fortunately, it is still possible to run some of the tests. Among them, the marketing team is asking for a split test on the home page of the corporate site. This means that entirely different versions of the page will be tested. Well, why not, thinks Matthew…

A street name on a wall, stating 'Rue d'enfer', french for Hell's street

"Rue d’Enfer" by Frédéric Bisson - CC BY 2.0

Unfortunately, this request adds to the pile of other requests, some of which actually concern similar pages. Potentially, users could unknowingly undergo several A/B tests within a single page. On the product page, for example:

  • one A/B test relating to the font for the product name;
  • one A/B test relating to the call-to-action text for the add-to-cart feature;
  • one last test that would influence the real-time display of product data.

While it is technically possible (by stretching the concepts that are already in place for single tests), this multivariate analysis does raise the issue of the increasing complexity of statistical analysis, which was already a delicate task. Because with all these tests, the number of versions of the site increases exceedingly fast. Matthew is now in charge of:

  • one A/B/C split test on the home page;
  • three A/B tests on the product page;
  • one A/B test involving a variation of the navigation structure…

… this means 18 different possible combinations for each visitor and a significant increase in maintenance costs (because now, to reproduce a bug you have to use the exact same configuration as the client browser on which it occurred). The issue of tracking must also be added to these costs, because the last test has the direct consequence of distorting existing analytics, which until now were based on URLs.

A/B testing, getting the right tools

Doing some research, Matthew discovers a few companies offering products that facilitate A/B testing. Most of them internalize two of the major issues: statistical analysis and campaign management. Some products can even automate campaigns and end them once a meaningful result has been obtained. Unfortunately it is very difficult to determine the value of a solution over another, since each of them seems to be adapted to a particular need:

  • For commercial teams, some solutions come on top of the Front End to modify the page viewed by the customer on the fly. The concept seems appealing at first, but users sometimes end up experiencing slowdowns, page flashes and even, in the most extreme cases, SPOF situations (Single Point of Failure: a situation in which the site relies heavily on one or more external resources; if these resources are not available or a technical problem makes it impossible to access them from the client — network problem, unreliable gateways — then the page can no longer be viewed);
  • other more “injection-oriented” solutions make it possible to easily create switches between multiple software architectures;
  • finally, other solutions make it possible to quickly switch from one architecture to another, but they introduce additional gateways into the system, leading to increased risks and decreased performance.

So Matthew knows that he will need to do some more research on these products and select the best solution to address the issues he faces. But beyond that, he is also starting to get the impression that…

A/B testing has many limitations

The first of these limitations lies in the adaptation capability. Any optimization project consists in getting closer to the best solution by comparing several variations. But it does not mean that the most successful one is the absolute best of all variations. Just because a local optimum is reached (around the original conditions) does not mean that there is no other, very different variation producing better results.

Une représentation mathématique en 3D présentant un maximum local

Parfois, on a l’illusion de l’optimisation. Alors que le sommet est plus loin.

For instance, let us imagine that we proceed to a multivariate analysis consisting of two tests, each with about fifteen variations (the scenario is extreme, but it serves the demonstration well). In this case, experimenting with the variations of both tests consists in moving along the yellow plane of the graph, in search of the best possible performance. Once at the highest point of the yellow peak, nothing tells us that there is actually a higher peak elsewhere and that we would have found it, had we continued our tests with a greater number of variations. Moreover, an A/B test will never say what we want it to say. In Matthew’s example with the product image vs. product video, the test’s result was that product images were the most effective solution, but Matthew has no clue that this is probably the consequence of two factors: on the one hand, users are accustomed to viewing videos in landscape rather than portrait mode, and on the other hand, they are unable to stay focused when presented with an interactive medium. Promoting A/B testing is certainly a good thing… as long as you ask professionals to help you understand how to interpret their results! In addition, there are a number of other obvious limitations:

  • A/B testing knows nothing about your visitors. It does not know whether they are old, young, tech-savvy, loyal… yet different profiles can have entirely different behaviors and decision-making processes, and you will only get an overall view of this. You will need to complete your A/B testing system with a quality analytics tool or a tracker, allowing you to properly segment feedback from these different types of visitors;
  • Running an extravagant number of multivariate analyses requires an increasing amount of visitors: for this reason, it is not possible to “test everything” in the hope of finding the right formula, especially considering that calculating the conversion rate is probably more complex than simply adding up all scenarios;
  • A/B testing is a short-termist solution that does not take into account the learning curve of your visitors. Therefore it does not have the same relevance for mass retailers and for companies with sophisticated products and a thoroughly planned sales process.

A/B Testing, in the end

Consulted by senior management, Matthew tells them all about his experience with A/B tests. Initially seen as a magical decision-making tool, A/B testing is actually more complex and costly than expected. In fact, just like all tools, A/B Testing must be handled by experts with the best possible knowledge of the context. Well, that is until an A/B test proves the opposite!

Opera Dragonfly Search Form is great

I had planned for several months to go to Toulouse for the SudWeb Conference and Workshops, and I had even proposed a subject. Even if my submission had not been selected, I was very proud to go there and meet people united by the common values of Web Standards, innovation, agility… and long story short, I finally became a speacker but that’s another story (in French).

The second day, during a workshop organised by Karl Dubost (Opera) and Anthony Ricaud (Mozilla), I explained that many Front-End developpers I work with do not know how to use the query-selector, and are frustrated not to be able to search a specified group of selectors without using javascript in the Dev. Tools Console. In fact, what I was expressing already exists in Opera Dragonfly.

Wanna see more? Read this article written by Karl: Search DOM Nodes with Opera Dragonfly Developer tool

And here is a short video of what this workshop looked like:

First test of the layout

This is a test post for typographic matters.

Test

  • “foo” ‘bar’1

more tests

  • 3rd at the 4% run
Oh, some encoded "code" but not double encoded: &amp;!

I arrived in 2’33’’ vs. 2’44’’ for my competitors!

Has he arrived 3rd, or 1st? He’s 1st. No: 3rd.

I’m “very happy” that you invited yourself!

&lt;a href=""&gt;
<a href="">
pre

His living room measure 4x5m, which is quite small.

Some JS code:

if (monObjet) {
    // On entrera que si monObjet n'est pas considéré comme faux
    // donc différent de false, "", undefined, null ou NaN
}

// équivaut à
monObjet && // portion de code

// équivaut à
!!(monObjet) && // portion de code

Some CSS:

.container {
    background: #fff url('background.png') repeat-y 50% 0;
}

I am fond of typography.

I am fond of typography.

Espace fine insécable

Case glutonny: “Citation forte!” vs “Citation forte!”.

// aa aa aa aa aa aa aa aa aa aa aa aa aa aa aa aa aa aa aa aa aaaaaa a
  1. toto ↩